What this research found
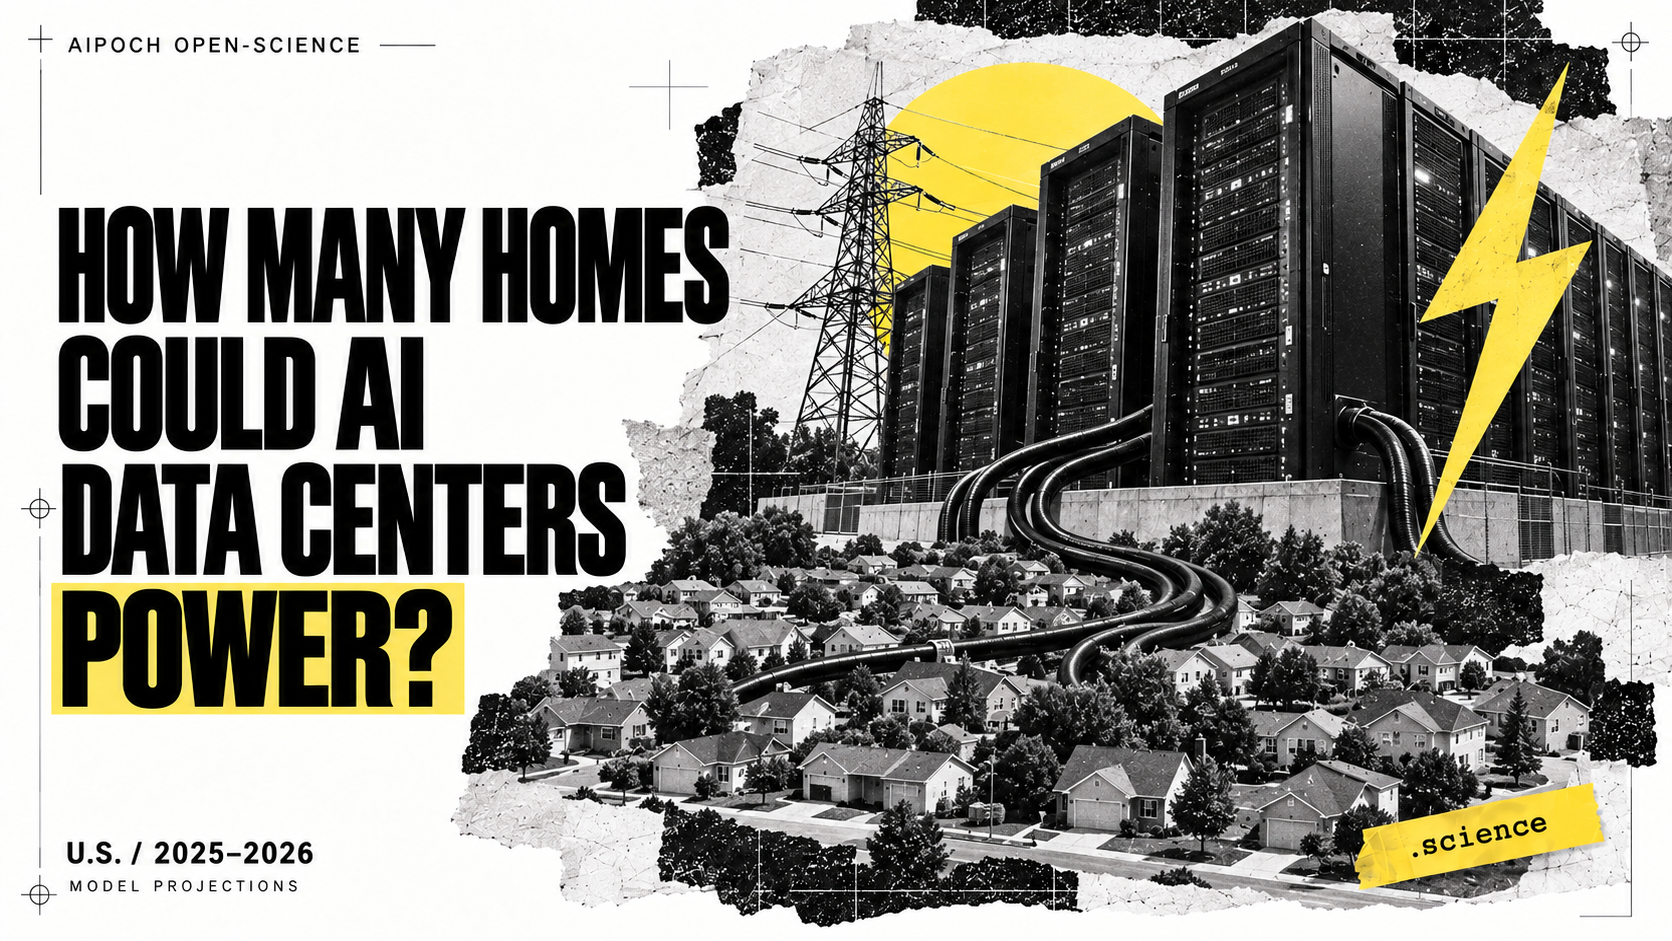
How Many Homes Could AI Data Centers Power?
Research topic and question
- How much electricity do AI data centers use in a year, and how many homes is that equivalent to? Use the latest public figures you can find, matching the year and region for the comparison. I'd like to see how the answer changes depending on what counts as AI data center use and how household electricity use is measured.
- Can you also work out the AI-only comparison for the U.S. using the AI-server breakdown in the Berkeley Lab report, including cooling and other facility overhead? Compare it with U.S. households in the same year, and make a chart showing how the different definitions change the answer. If a number has to be estimated from a chart, please make that clear.
- Here's Figure 9 from the report. Please use it to finish the calculation and chart, with any chart-reading estimate clearly marked.
- Can we update this with the newest data available? I'd like 2025 to be the main comparison, or 2026 if there is a credible estimate. Please keep the year and region matched, distinguish estimates from measurements, and update the chart. If a newer AI-only comparison isn't possible, explain exactly which figure is missing rather than treating all data centers as AI.
- I found the source data for Figure 1 of this paper: https://www.nature.com/articles/s41893-025-01681-y. Could its 2025 and 2026 U.S. AI projections give us a same-year comparison? Please check whether cooling is already included, use the latest EIA household figures for each year, and show these as model projections rather than measured consumption.
Research findings
Yes—the spreadsheet fills the earlier gap for a model-based comparison. Its mid-case U.S. AI projections correspond to 6.18 million homes in 2025 and 11.24 million in 2026.
| Year | AI electricity, including overhead | EIA annual electricity per residential customer | Equivalent homes |
|---|---|---|---|
| 2025 | 64.77 TWh — model projection | 10,479 kWh — historical estimate | 6.18 million |
| 2026 | 117.90 TWh — model projection | 10,487 kWh — forecast | 11.24 million |
Cooling is already included. The paper calculates electricity using server consumption and regional PUE, which incorporates facility overhead. Applying another cooling multiplier would double-count it. These are the paper’s 2025-vintage projections for top-tier AI servers, not measured national consumption. Paper and methods.
The household denominators come from the latest available September 2026 EIA outlook. “Homes” means mean purchased-electricity equivalents per residential utility customer—not median household consumption or total household energy. Both year and region match. EIA Table 7a.
Across the five spreadsheet scenarios, the equivalents span 6.00–6.18 million in 2025 and 11.06–11.24 million in 2026. These are scenario ranges, not confidence intervals. All values came directly from the spreadsheet; no chart-reading estimates were needed.


Run this kind of analysis on your own question
Start a session and see how an AI co-scientist accelerates your research. Pay-as-you-go, nosubscription required.