What this research found
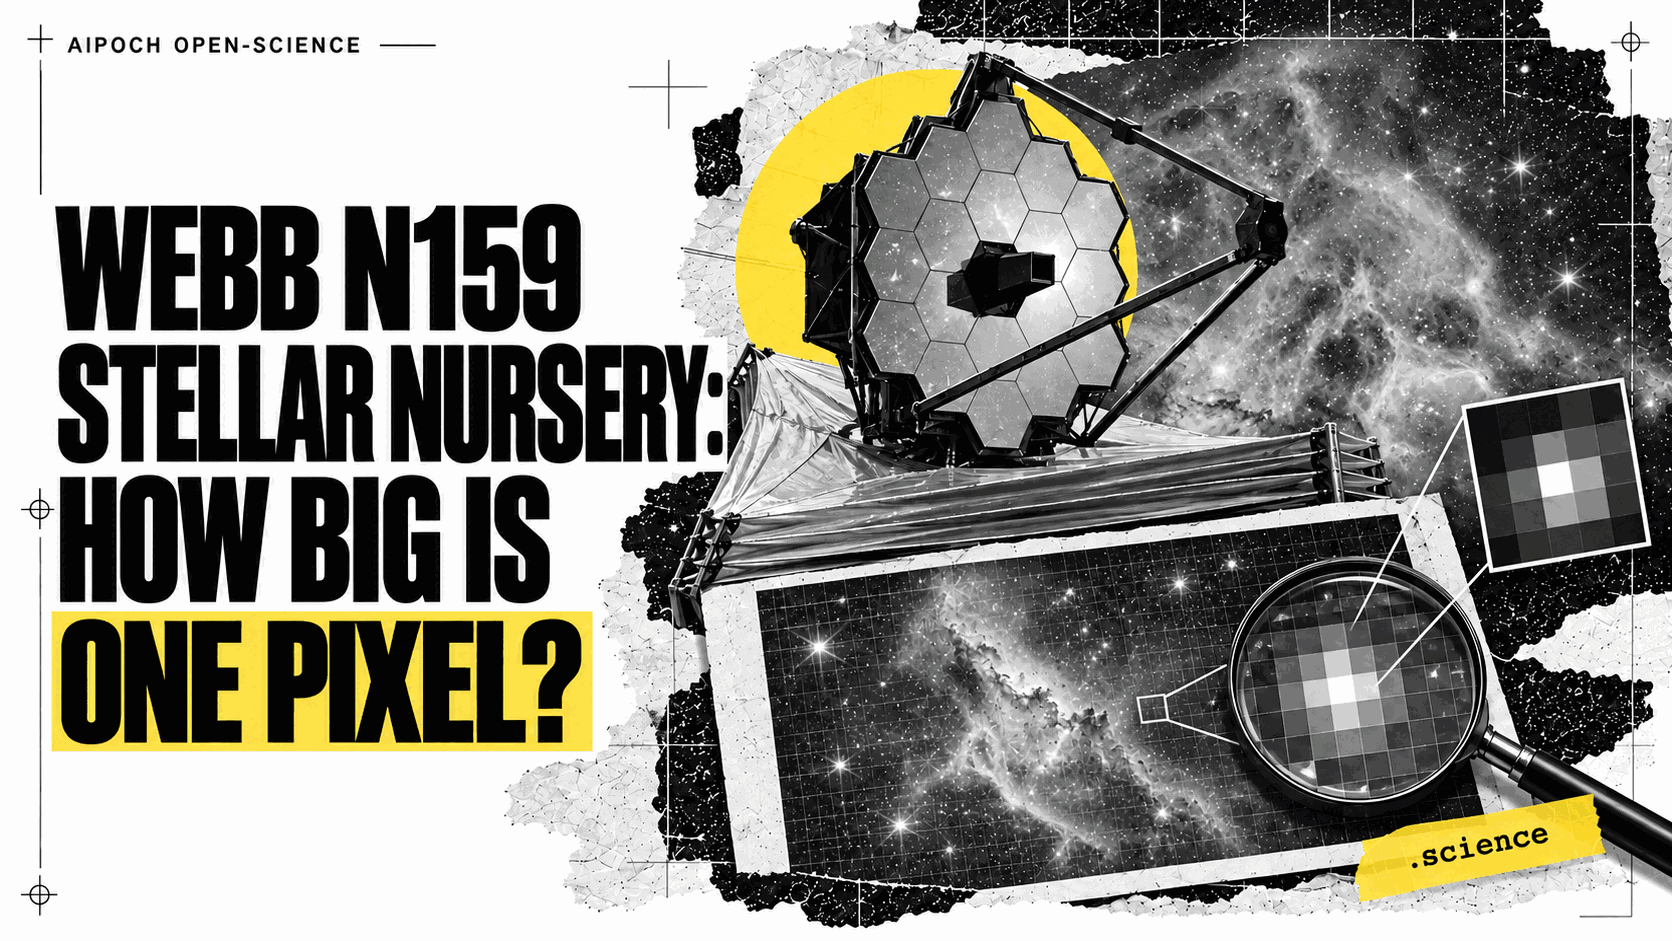
Webb N159 Stellar Nursery: How Big Is One Pixel?
The question
A beautiful Webb image contains millions of pixels—but what distance does one of them represent in the scene? And if a pixel spans thousands of astronomical units, does that tell us the size of the smallest object the telescope can resolve?
This case follows an N159 stellar-nursery outreach image from its sky coverage to a physical scale, then compares nested crops, instrument point-spread-function references, and resized copies. It connects a familiar action—zooming into a photograph—to three different quantities: the field shown, the sampling interval, and the resolving power of the observations.
For the supplied 4000 × 2667 JPEG, one horizontal pixel corresponds to approximately 0.0756 arcseconds, or 0.0590 light-years: about 21.55 light-days or 3,732 AU. These physical values assume a distance of 161,000 light-years and that the uploaded JPEG retains the entire published 5.04 × 3.36 arcminute field. They describe sampling on a projected image plane, not a measured stellar diameter or a demonstrated resolution limit.
Start with the actual image, not a different file's metadata
The session received four inputs: a JPEG, image metadata, source notes, and a ten-row empirical NIRCam PSF reference table. An important initial check found that the JPEG and metadata describe different raster files.
| Property | JPEG actually analyzed | Larger image described by the metadata |
|---|---|---|
| Dimensions | 4000 × 2667 | 9694 × 6463 |
| File size | 5,004,511 bytes | 19,838,984 bytes |
| Byte identity | Its own recorded SHA-256 | A different recorded SHA-256 |
| Use in the calculations | Pixel counts, crops, and resizing all refer to this JPEG | Source context; its dimensions cannot be used as the analyzed pixel grid |
The proportions are compatible with resizing, but dimensions alone do not prove that no earlier cropping occurred. Consequently, retaining the published full field is an explicit assumption, rather than a verified property of the uploaded file. The supplied notes' statement that the original downloaded bytes were unchanged does not describe this smaller JPEG.
The source attributes N159 to the Large Magellanic Cloud and gives an approximate distance of 161,000 light-years. A two-dimensional field size is not the total size or line-of-sight depth of the nebula.
Turn angular coverage into projected distance
For each image axis, the calculation uses distance D, angular field theta, and actual pixel count N:
theta in radians = field in arcminutes × pi / 10800
projected extent = 2 × D × tan(theta / 2)
angular sampling = 60 × field in arcminutes / N
projected sampling = projected extent / N
The conversion uses a Julian year of 365.25 days and approximately 63,241.077 AU per light-year. Horizontal and vertical values are computed separately rather than forcing a perfectly square sampling interval.
| Quantity | Horizontal | Vertical |
|---|---|---|
| Actual pixel count | 4000 | 2667 |
| Assumed full field | 5.04 arcmin | 3.36 arcmin |
| Projected coverage | 236.038370 ly | 157.358898 ly |
| Angular sampling | 0.075600 arcsec/pixel | 0.075591 arcsec/pixel |
| Projected sampling | 0.059010 ly/pixel | 0.059002 ly/pixel |
| Light-travel-distance equivalent | 21.553254 light-days/pixel | 21.550558 light-days/pixel |
| Astronomical units | 3731.830 AU/pixel | 3731.363 AU/pixel |
The tiny axis difference, approximately 0.0125%, reflects the supplied approximate field values and integer image dimensions. Extra digits retain the calculation trail; they do not establish that the distance or field was measured to that precision. Angular sampling depends on field and pixel count. Physical scale additionally changes in direct proportion to the assumed distance.
The source's prose describes an approximately 230-light-year image width. The calculation from its listed distance and angular field gives 236.038 light-years, about 2.6254% larger relative to 230. The archive retains both values and does not tune inputs to make them agree. Their discrepancy is not explained by choosing the small-angle approximation: that changes the calculated width by only about 0.0000423 light-years. No formal source uncertainty or established cause is supplied.
Nested crops keep their place in the original scene
A crop can look much larger on screen without changing the physical area it contains. The archived figure links each close-up to its exact parent coordinates.
| View | Bounds in the original JPEG: left, top, right, bottom | Dimensions | Projected coverage | Scale bar |
|---|---|---|---|---|
| Full image | 0, 0, 4000, 2667 | 4000 × 2667 | 236.04 × 157.36 ly | 50 ly |
| Region | 2400, 640, 3600, 1440 | 1200 × 800 | 70.81 × 47.20 ly | 20 ly |
| Close-up | 2800, 800, 3200, 1064 | 400 × 264 | 23.60 × 15.58 ly | 5 ly |
Bounds are zero-based outer pixel edges, with the origin at the upper left, x increasing rightward, y downward, and right/bottom bounds exclusive. They refer to the 4000 × 2667 JPEG, not the larger metadata image. The corresponding crops use image.crop((left, top, right, bottom)) or array[top:bottom, left:right].
For plots labeling pixel centres with integer indices, centre (i, j) lies at edge-coordinate position (i + 0.5, j + 0.5). Keeping that convention separate prevents small scale-bar and crop-box placement errors. The 50-, 20-, and 5-light-year bars correspond to approximately 847.32, 338.93, and 84.73 original pixels respectively.
A pixel interval is not an optical resolution measurement
A point-spread function (PSF) describes how an effectively point-like source appears in an image. Its full width at half maximum (FWHM) describes the central profile's width at half its peak above background. FWHM is neither a stellar diameter nor a universal two-source separation threshold.
The case uses the attachment's empirical calibration-star FWHM values. Dividing each angular width by 0.0756 arcseconds per horizontal JPEG pixel gives a reference width on this grid:
| NIRCam filter | Empirical FWHM, arcsec | Equivalent horizontal JPEG pixels |
|---|---|---|
| F115W | 0.040 | 0.529 |
| F140M | 0.048 | 0.635 |
| F187N | 0.064 | 0.847 |
| F210M | 0.071 | 0.939 |
| F212N | 0.072 | 0.952 |
| F300M | 0.100 | 1.323 |
| F335M | 0.111 | 1.468 |
| F360M | 0.120 | 1.587 |
| F460M | 0.157 | 2.077 |
| F470N | 0.160 | 2.116 |
The comparison needs no distance conversion. A reference core narrower than one JPEG pixel indicates poor sampling of that reference profile on this grid; it does not reveal resolved subpixel detail. These are selected instrument reference values, not measured PSFs of the released composite. The selected rows alone do not establish an exposure inventory or a mapping from filters to displayed colour channels. Combining observations, resampling, and outreach processing can alter apparent widths.
Detection, resolution of physical extent, and separation of adjacent sources are therefore distinct questions. An unresolved source can still be detected, while a large displayed star image can reflect the PSF and processing rather than the star's true size.
What reduction and enlargement actually change
The archive compares a 400 × 264 close-up, a 100 × 66 reduction using BOX area averaging, and a bicubic enlargement back to 400 × 264. Each reduced pixel averages a 4 × 4 input block, leaving one-sixteenth as many pixels. Displaying all panels at the same size makes the loss of fine structure visible.
Bicubic interpolation estimates intermediate values and smooths blockiness. It cannot restore information discarded during averaging. The operations use the outreach JPEG's display-encoded RGB values, not calibrated astronomical flux, and apply no sharpening.
The full-frame comparison addresses a different operation: retaining the entire scene while changing its output raster.
| File version | Reopened dimensions | Angular sampling, x / y | Projected sampling, x / y |
|---|---|---|---|
| Uploaded JPEG | 4000 × 2667 | 0.075600 / 0.075591 arcsec/pixel | 0.059010 / 0.059002 ly/pixel |
| 4000-wide PNG | 4000 × 2667 | 0.075600 / 0.075591 arcsec/pixel | 0.059010 / 0.059002 ly/pixel |
| 1920-wide PNG | 1920 × 1280 | 0.157500 / 0.157500 arcsec/pixel | 0.122937 / 0.122937 ly/pixel |
The 4000-wide PNG preserves the JPEG's decoded pixels. The smaller PNG uses Lanczos reduction and retains the full frame. Its ideal height of 1280.16 rounds to 1280, introducing only an integer-pixel aspect-ratio difference of about 0.0125%. All versions cover the same assumed sky field: fewer pixels mean more sky per output pixel, not less sky in the frame.
What the case establishes—and what it leaves open
| Question | Supported interpretation |
|---|---|
| How large is one original JPEG pixel? | About 0.0756 arcsec and, under the stated assumptions, 0.0590 projected light-years. |
| Does zooming improve resolution? | Enlargement changes display sampling; it does not recreate lost information or improve the telescope's optical response. |
| Is the apparent star width its physical diameter? | No; PSF, sampling, and processing intervene. |
| Can RGB values yield calibrated stellar properties? | The outreach JPEG alone does not establish temperatures, masses, diameters, or calibrated fluxes. |
| Is 236 ly the full extent of N159? | It is the calculated projected width of the assumed image field, not the total nebula or its depth. |
| What is needed for more precise claims? | Calibrated observations, astrometric/WCS information, appropriate PSF analysis, and source uncertainties. |
Saved materials and verification scope
The native export retains the conversation, inputs, calculations, intermediate artifacts, and a final n159_verified_package.zip. That inner ZIP contains the corrected report, six analysis figures, four CSVs, crop coordinates, full-frame copies, the original four inputs, a reproduction script, and delivery checks. Its relative links are intended for use after extracting that complete inner ZIP; this web introduction uses only absolute external source links.
The recorded delivery check reopened the ZIP, compared the saved inputs and tables, checked image decoding and links, and ran the archived reproduction script successfully in a clean extraction. That script recalculates scales and image arrays and assembles an overview from five supplied figure PNGs; it does not regenerate every individual plot layout. The shorter archived check record is distinct from an earlier long Markdown record that was unavailable at that stage; missing text was not reconstructed.
For this publication, the supplied package's inventory and content-evidence references were checked and its native application import was tested. The archived research code was not rerun. Transfer/import integrity does not independently verify every scientific assumption or establish the JPEG's full-field provenance.
Sources, credits, and provenance
Primary references are ESA/Webb's N159 release, STScI's NIRCam PSF documentation, and Webb's image-processing explanation.
Source image credit: ESA/Webb, NASA & CSA, E. Sabbi, M. Zamani (ESA/Webb). Acknowledgement: M. H. Özsaraç. Reuse of the source image follows the ESA/Webb conditions. Analysis overlays, crops, resampling, and explanatory plots are separate from the source observation. The accompanying generated collage cover is illustrative and is not an astronomical measurement or an institutional endorsement.
This introduction summarizes the supplied AIPOCH Open-Science session. The original native export and its internal evidence are preserved byte-for-byte; publication normalizes only the external package filename, replacing spaces with hyphens.


Run this kind of analysis on your own question
Start a session and see how an AI co-scientist accelerates your research. Pay-as-you-go, nosubscription required.