What this research found
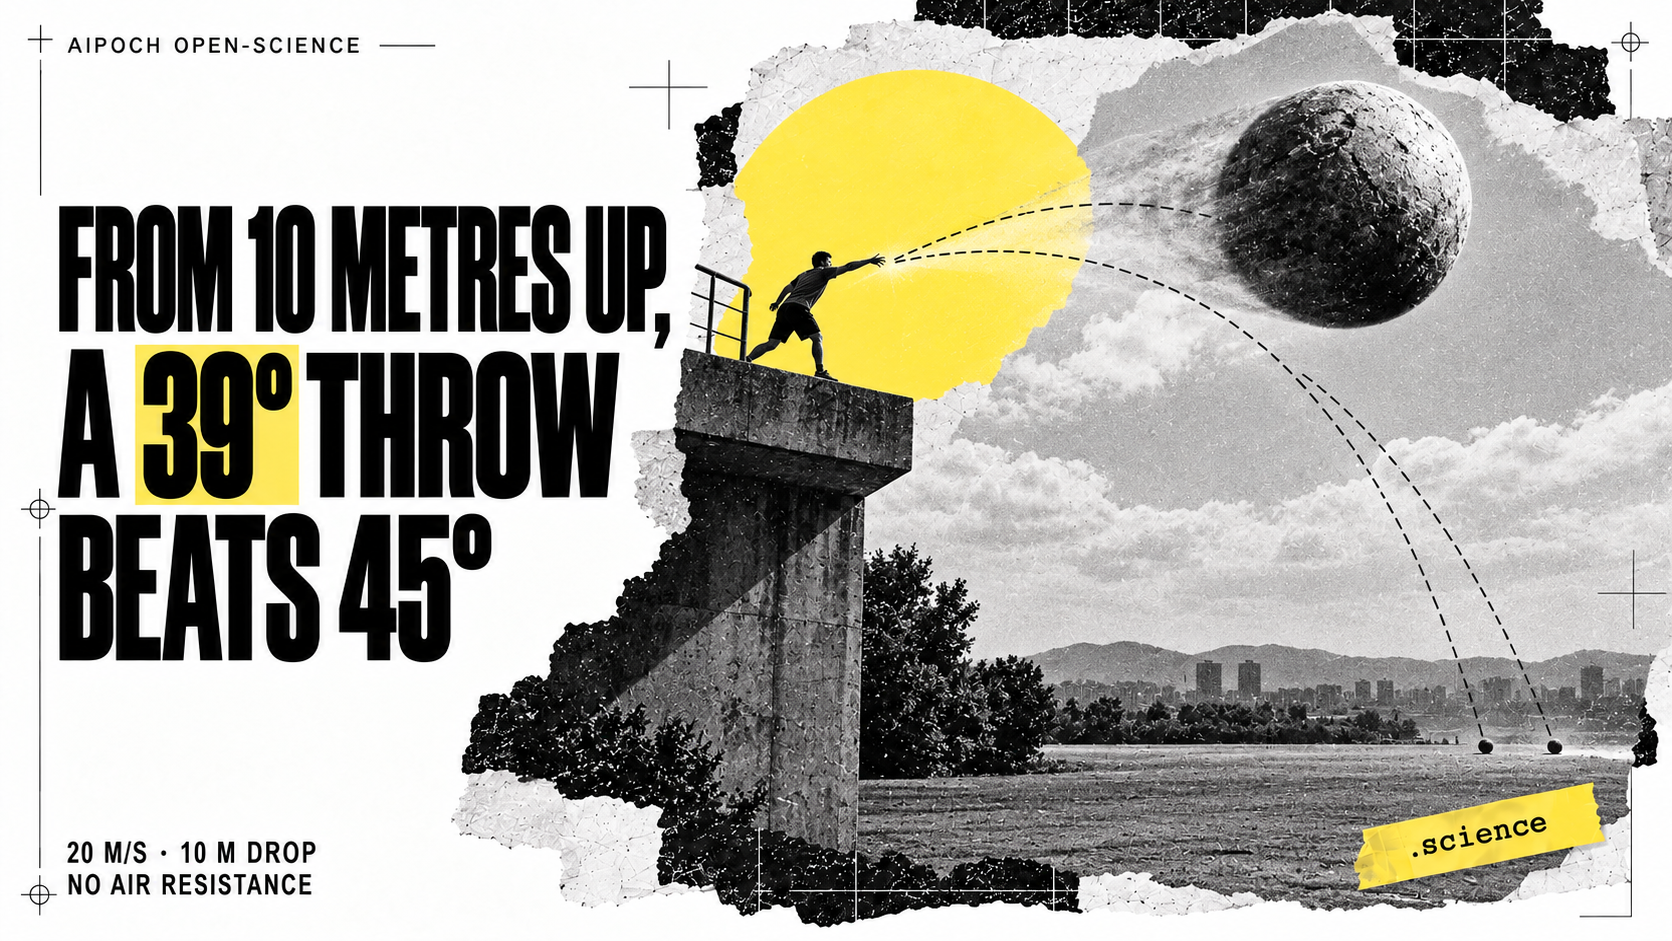
From 10 Metres Up, a 39° Throw Beats 45°
Research question
Is 45° still the best launch angle when a ball lands below its release point? This case compares a 20 m/s throw from 10 m above the landing surface at 45° and at the angle that maximizes horizontal range, then repeats the comparison at release heights of 0, 2, and 20 m.
Model and method
The calculation holds launch speed fixed at 20 m/s, uses constant downward gravity 9.8 m/s², and ignores air resistance. Height h is measured above a horizontal landing surface; the release point is x = 0, y = h. The background reference supplied in the session is OpenStax, Physics §5.3: Projectile Motion, which describes resolving horizontal and vertical motion separately under the no-drag assumption.
For launch angle theta above horizontal, the saved plotting code uses:
x(t) = v cos(theta) ty(t) = h + v sin(theta) t - g t² / 2t_land = (v sin(theta) + sqrt((v sin(theta))² + 2gh)) / grange = v cos(theta) t_land
For h >= 0 and upward launch angles, the maximizing angle is atan(v / sqrt(v² + 2gh)), and the maximum range is v sqrt(v² + 2gh) / g. These formulas give 45° at ground level and a shallower optimum at positive release height.
Results
At 10 m, the calculated optimum is 39.3254°. The 45° throw travels 49.1250 m, while the optimum travels 49.8227 m, a gain of approximately 0.70 m. Lowering the angle trades vertical launch speed for horizontal speed; starting above the landing surface supplies additional fall time.
The saved height-comparison run reports the following ranges. The loss column is computed before rounding the two range columns.
| Release height | Range at 45° | Maximum range | Range lost at 45° |
|---|---|---|---|
| 0 m | 40.8 m | 40.8 m | 0.00 m |
| 2 m | 42.7 m | 42.8 m | 0.04 m |
| 10 m | 49.1 m | 49.8 m | 0.70 m |
| 20 m | 55.5 m | 57.4 m | 1.91 m |
projectile_throw.png overlays the 45° and optimal trajectories from 10 m, from release to landing. height_comparison.png shows 45° trajectories only at the four heights; it does not plot every optimal trajectory. The optimal ranges for those heights are supplied by the table and Notebook calculations.
Evidence and limits
The package contains the conversation, both PNG plots, Notebook code and recorded outputs, managed-file provenance, and execution evidence. One intermediate height-comparison cell failed because of an invalid function name; the subsequent corrected cell completed and produced the saved height chart and table. The first plotting cell also contains an unused placeholder calculation; the plotted curves come from its later time-parameterized loop.
The numerical ranges, maximizing angles, and landing equations were independently recalculated during integration. The original charts and session data remain unchanged. This is an idealized calculation, not a measured throwing experiment: drag, spin, wind, and dependence of achievable release speed on angle are outside the model. The small gains shown here therefore do not establish an optimal technique for real athletes.
Provenance
The original .science package and cover PNG are imported unchanged from aipoch/open-science-usecases at a1d1bfcb7d1c7a85d3e4a465060fa87fddc6d284. Shanruoyu (@shanruoyu) contributed the case in 53aaf940.


Run this kind of analysis on your own question
Start a session and see how an AI co-scientist accelerates your research. Pay-as-you-go, nosubscription required.