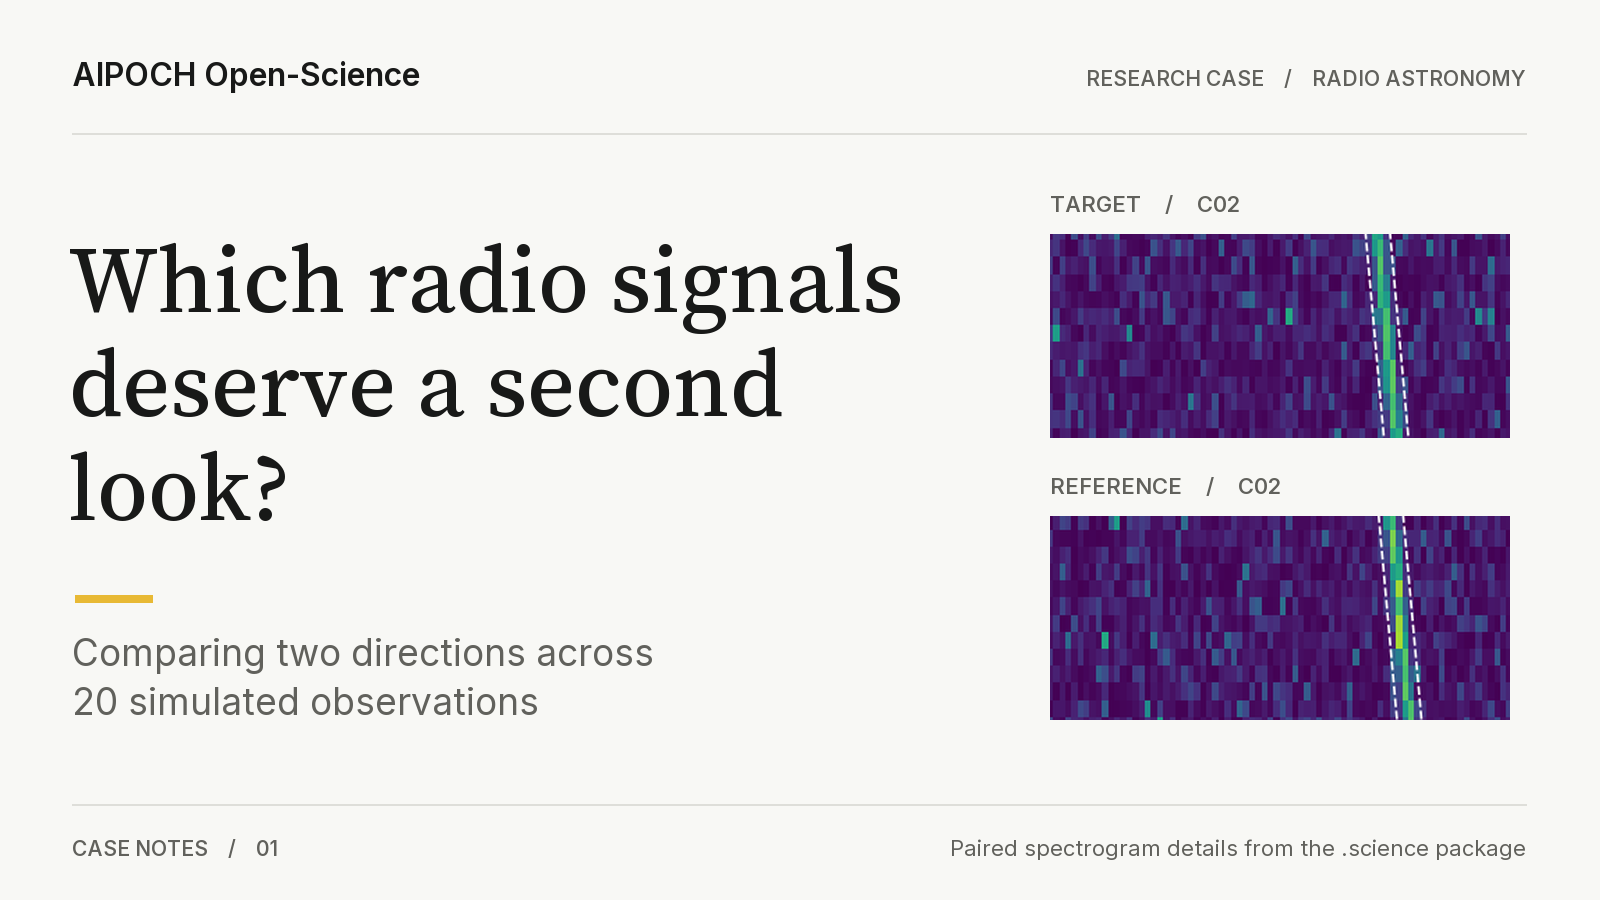
A bright line in a radio spectrogram is the beginning of a question, not an answer. In a radio astronomy teaching case, AIPOCH Open-Science records how 20 synthetic target–reference cases move through a follow-up rule. Its .science package lets readers inspect the inputs, calculations, figures, and decision record behind the labels. The case does not reproduce telescope observations or test an AI detector.
An October 2026 NVIDIA report describes agents helping operate and analyze data from the Allen Telescope Array, with a reported real-time detection of the known Crab pulsar. That news motivates a different, narrower question: when a signal looks interesting, what evidence justifies a next observation? The packaged AIPOCH example answers with a transparent simulation, not with a claim about extraterrestrial life.
Measuring a supplied track
The radio astronomy case in AIPOCH Open-Science uses supplied signal tracks and synthetic paired spectra to make follow-up decisions inspectable, letting readers connect each recommendation to the measured excess, the valid data available in both directions, and the calibration or instrument cautions supplied with the inputs.
The AIPOCH case record (2026) defines 20 paired cases, each with 32 time steps and 128 frequency bins. The case specification (2026) supplies the trajectory to measure for each case, so the analysis starts with a known track location.
In the package, paired_spectra.csv contains 20 cases × 32 time steps × 128 frequency bins, or 81,920 paired time–frequency rows. Each row contains target and reference power together with their separate validity flags. The spectra are synthetic: independent exponential noise with injected power along specified drifting tracks. Frequency is an offset in hertz and power is in arbitrary linear units. The record supplies no sky coordinates, observing band, calibrated flux, or measured receiver response.
The analysis is told where to measure along each supplied track. Start with simulation_spec.json and case_metadata.csv to see the construction and supplied cautions. Then open analysis_notes.md and final_report.md before interpreting a figure. The case's track-excess score compares mean valid power near the supplied track with a background estimate.
excess = mean valid track power / estimated background − 1
A score of 1 means twice that estimated background under the teaching rule; it is not a signal-to-noise ratio, significance, or source probability.
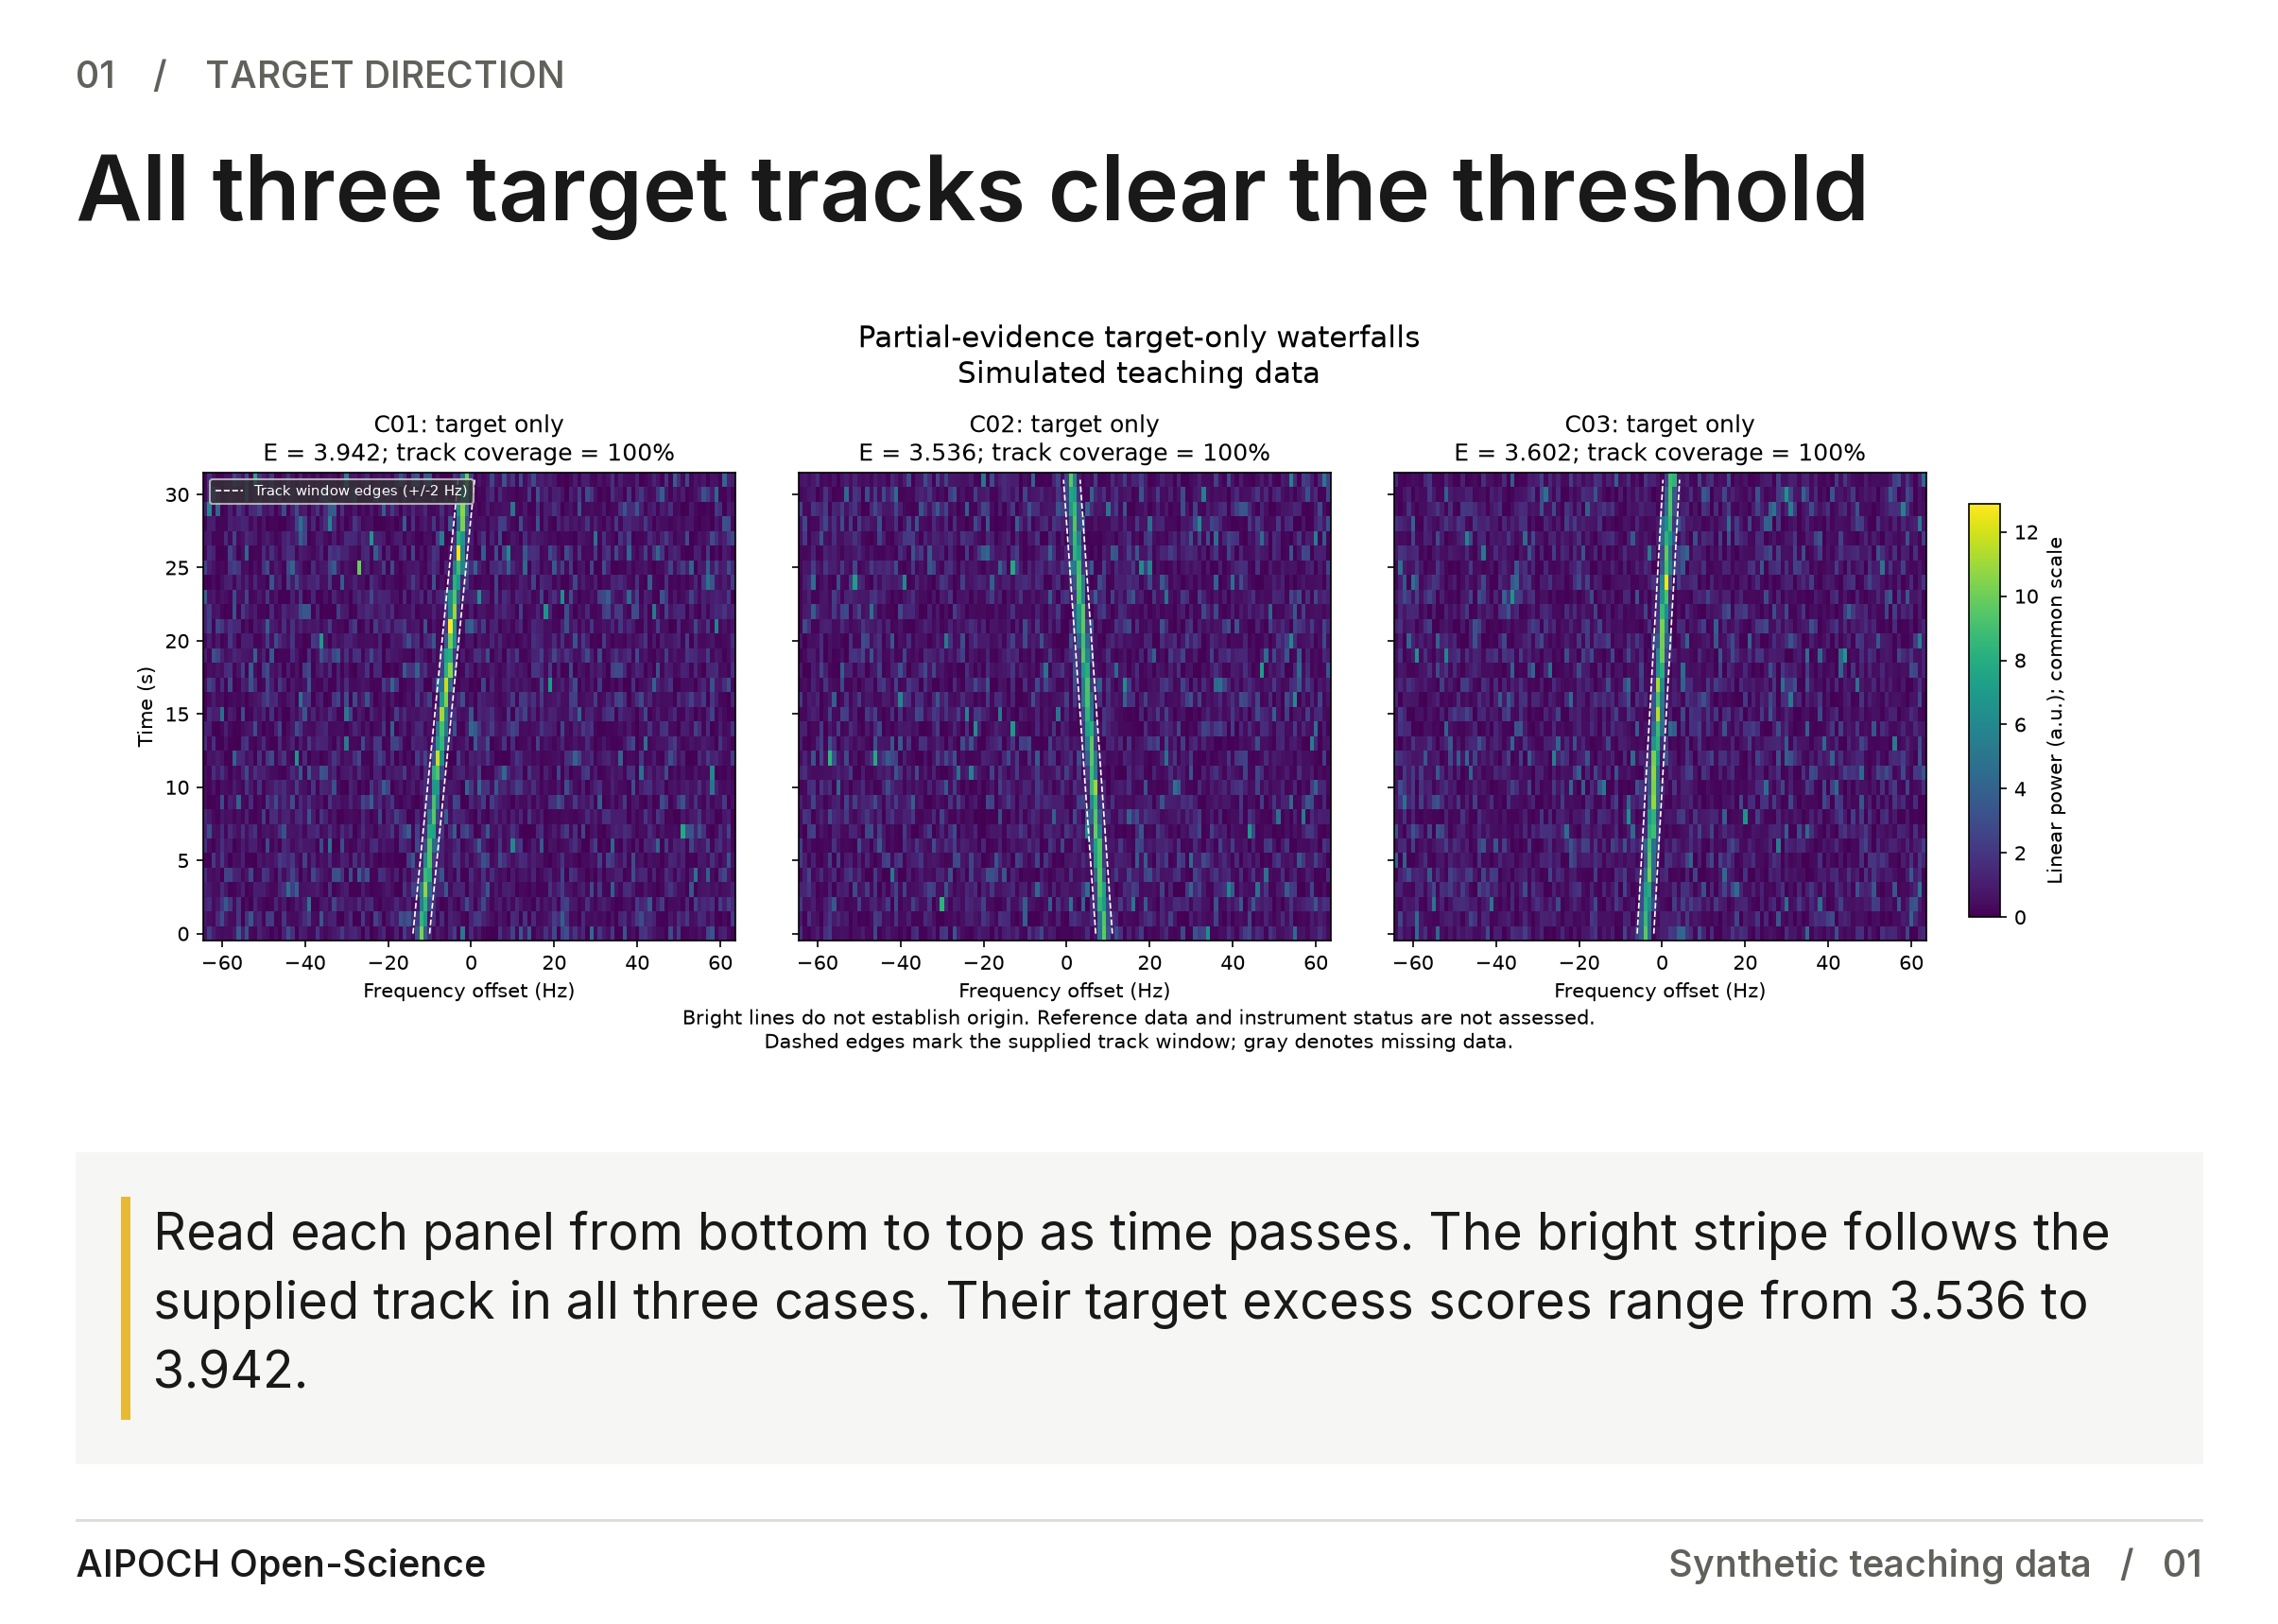
Figure 1. All three synthetic target tracks exceed the default threshold. Brightness alone leaves the next observation undecided.
Reference data and quality checks change the next step
Reference measurements and supplied quality metadata lead the three bright target tracks to different next checks, because C02 also exceeds the reference threshold while C03 carries calibration and instrument cautions that take priority in the decision rule, even though all four of C03’s coverage ratios are complete.
The AIPOCH case record (2026) assigns C03 to an instrument check using supplied status flags. The BLC1 verification flowchart (accessed 2026) calls for checking instrument behavior and accounting for bright sky signals that may enter an off-source observation.
Follow C01, C02, and C03 through the saved output. The target-only view makes all three look interesting, but different evidence determines the final recommendation.
| Case | Target excess | Reference excess | Decisive condition | Next check |
|---|---|---|---|---|
| C01 | 3.942 | 0.036 | Target passes, reference stays below threshold, quality gates pass | Worth follow-up |
| C02 | 3.536 | 3.964 | Both directions pass, with usable data and nominal status | Possible interference |
| C03 | 3.602 | 0.007 | Supplied calibration and instrument cautions trigger the quality gate | Check instrument |
C03’s reference score is low, just like C01’s. Its instrument-check label comes from the supplied metadata, rather than a fault diagnosed from the reference spectrum.
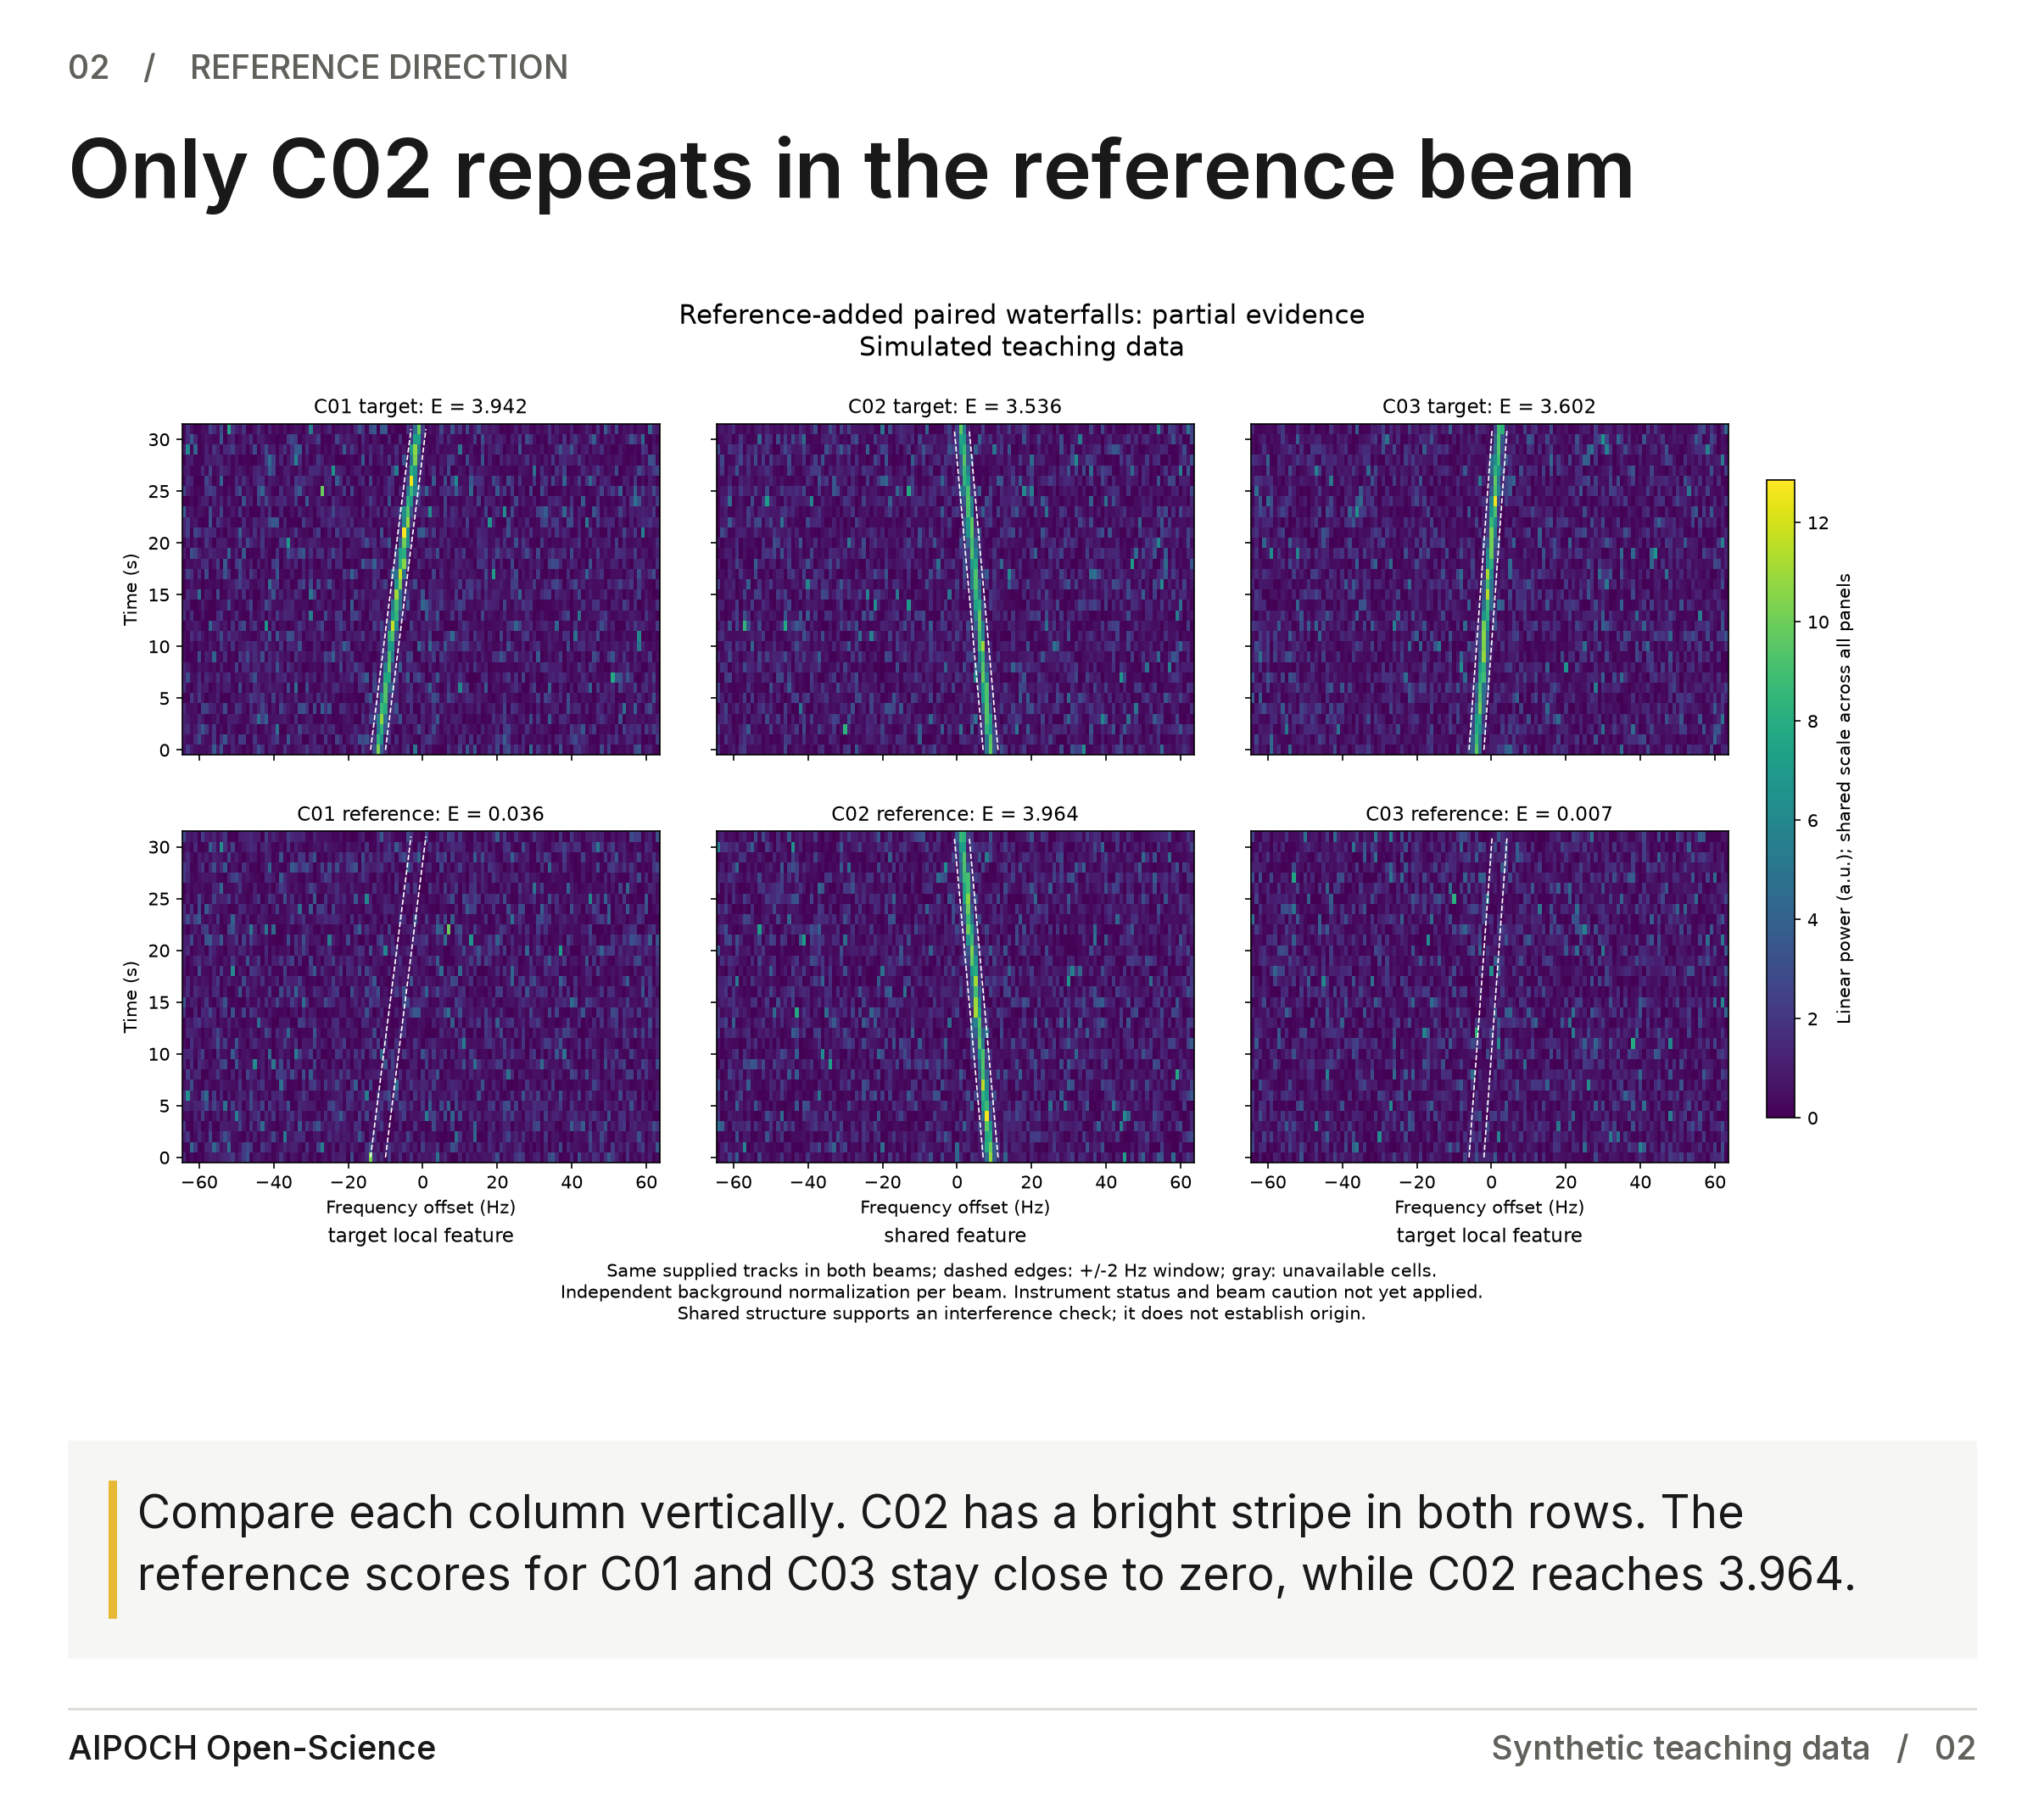
Figure 2. Among the three examples, only C02 also crosses the threshold in the reference direction, prompting an interference check.
The default rule uses an excess threshold of 1 and requires at least 90% valid-cell coverage in both the track and background regions of each beam. Each of the four coverage ratios divides valid cells by the geometric total in the corresponding region. C09 has no valid reference cells; the record keeps its reference score unavailable and labels the comparison insufficient data. After passing the instrument and data checks, C13 and C14 receive beam-response follow-up because both directions exceed the threshold and supplied sidelobe cautions require closer examination. Read quality_gated_results.csv alongside reference_added_waterfalls.png and coverage_status_overview.png to see those distinctions.
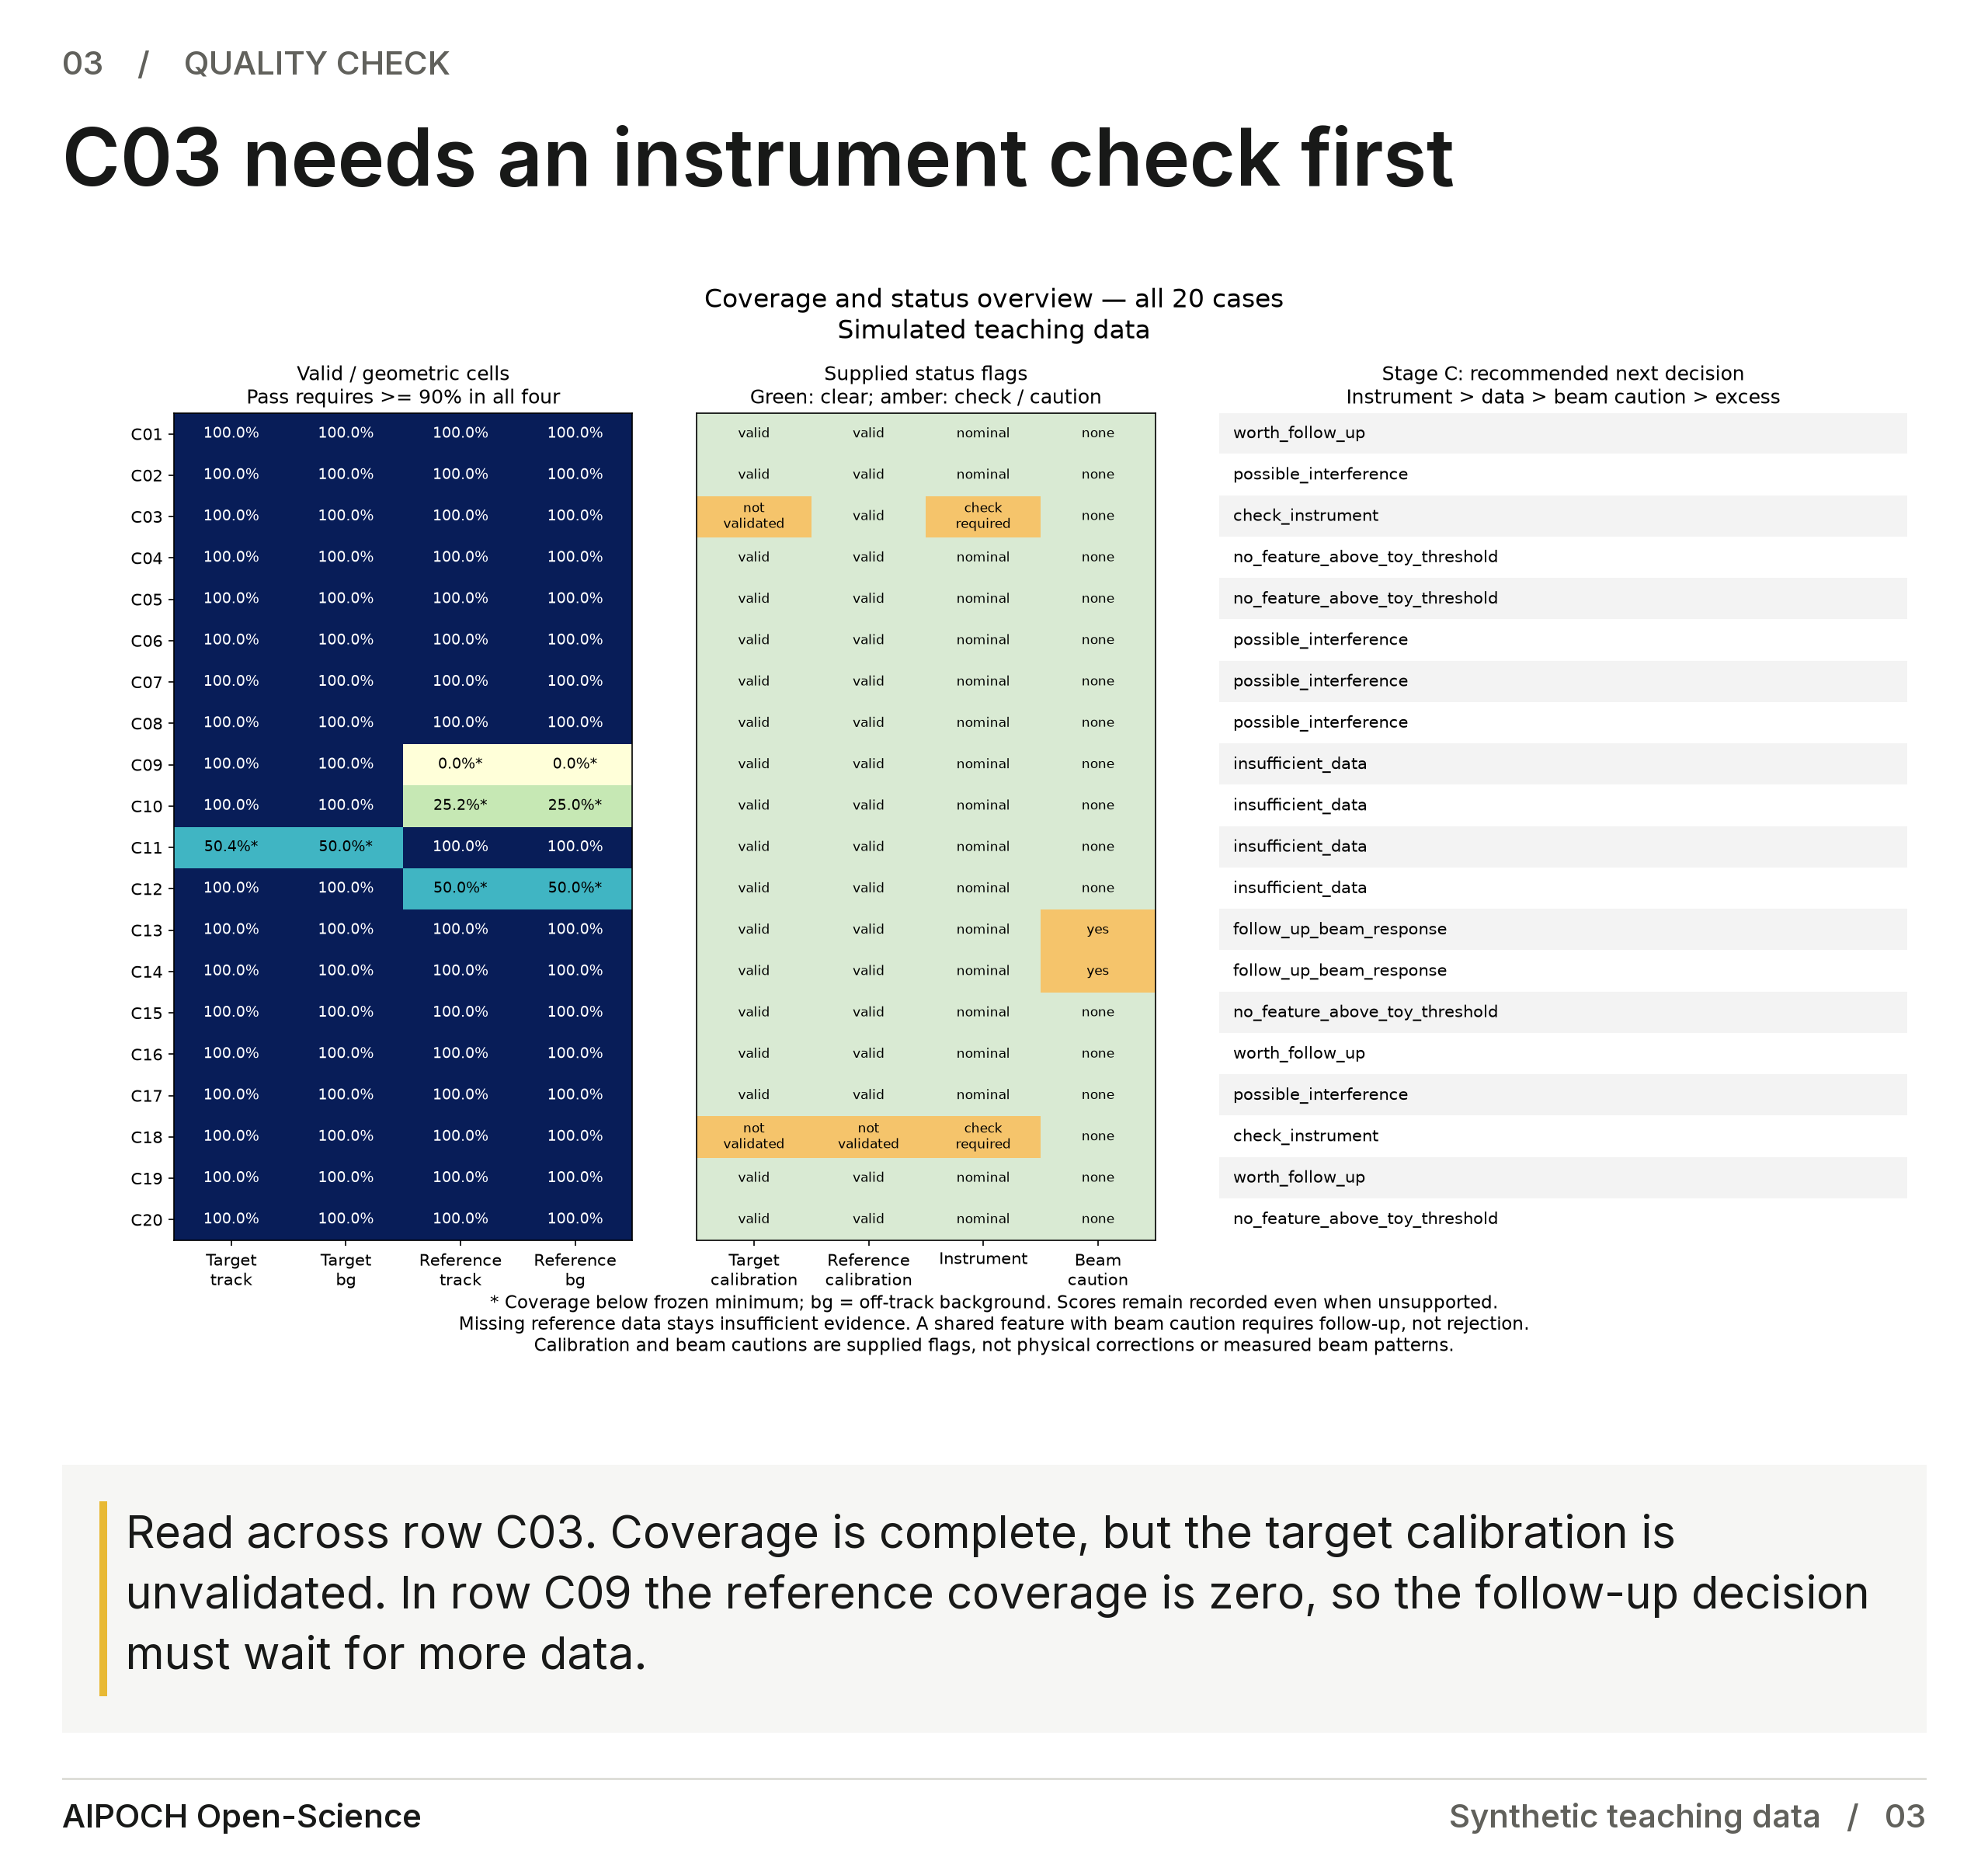
Figure 3. C03 has full coverage but needs a calibration check. C09 has no usable reference samples with which to compare its target signal.
Follow C01 and C02 through the .science package
The AIPOCH Open-Science radio astronomy package gives readers a concrete route through C01 and C02, from their similar target-only appearance to different final recommendations, by keeping the paired plots, measured scores, supplied quality conditions, and decision reasons together in a research record that can be inspected before any new calculation.
The AIPOCH .science guide (updated 2026) says imported sessions are read-only and do not execute code or restore credentials. The AIPOCH Open-Science product overview (checked 2026) describes persistent research artifacts and available links to inputs, code, execution history, and provenance evidence.
Open verified_radio_signal_review.zip in the package. The input spectra and case metadata are in inputs/paired_spectra.csv and inputs/case_metadata.csv. Compare C01 and C02 in target_only_waterfalls.png, then add reference_added_waterfalls.png. Check their measurements and reasons in case_evidence_progression.csv and quality_gated_results.csv, and inspect the rule in rebuild_analysis.py.
The saved sensitivity_full_grid.csv tests excess thresholds 0.5, 1, 1.5 and 2 against coverage thresholds 0.5, 0.7 and 0.9. Across all 12 combinations, 13 cases retain one final category and seven change category. The grid contains 240 case-setting rows. Stability includes cases that consistently require an instrument check or remain data-insufficient, and describes the rule’s behavior over those selected settings.
This article draws on static inspection of the archived inputs and saved results. The recorded rebuild validation describes checks performed in the original workflow. A received verification record does not establish a rerun on the reader’s computer.
Package contents depend on export selection. Imported history is read-only. In a compatible desktop app, choose Fork to continue to create a writable analysis, then confirm your own runtime, dependencies and permissions. Code does not execute automatically, credentials