使用已安装的 Specialist 扩展分析
案例演示 从茶碱浓度曲线扩展到实测暴露指标
使用 Pharmacometrics PK/PD Design Specialist 检查浓度随时间变化的数据,绘制曲线,再计算暴露指标。完成后得到十二位受试者的结果表、浓度曲线、可运行的 R 脚本和方法报告。本例用于公开研究数据的分析演示,不提供治疗或给药建议。
输入是 R 自带的公开 Theoph 数据集:十二位受试者的 132 条观测。时间单位为小时,浓度为 mg/L,体重为 kg,剂量为 mg/kg。计算只使用基础 R,无需额外安装包或配置数据库凭据。
1. 安装并选择 Specialist
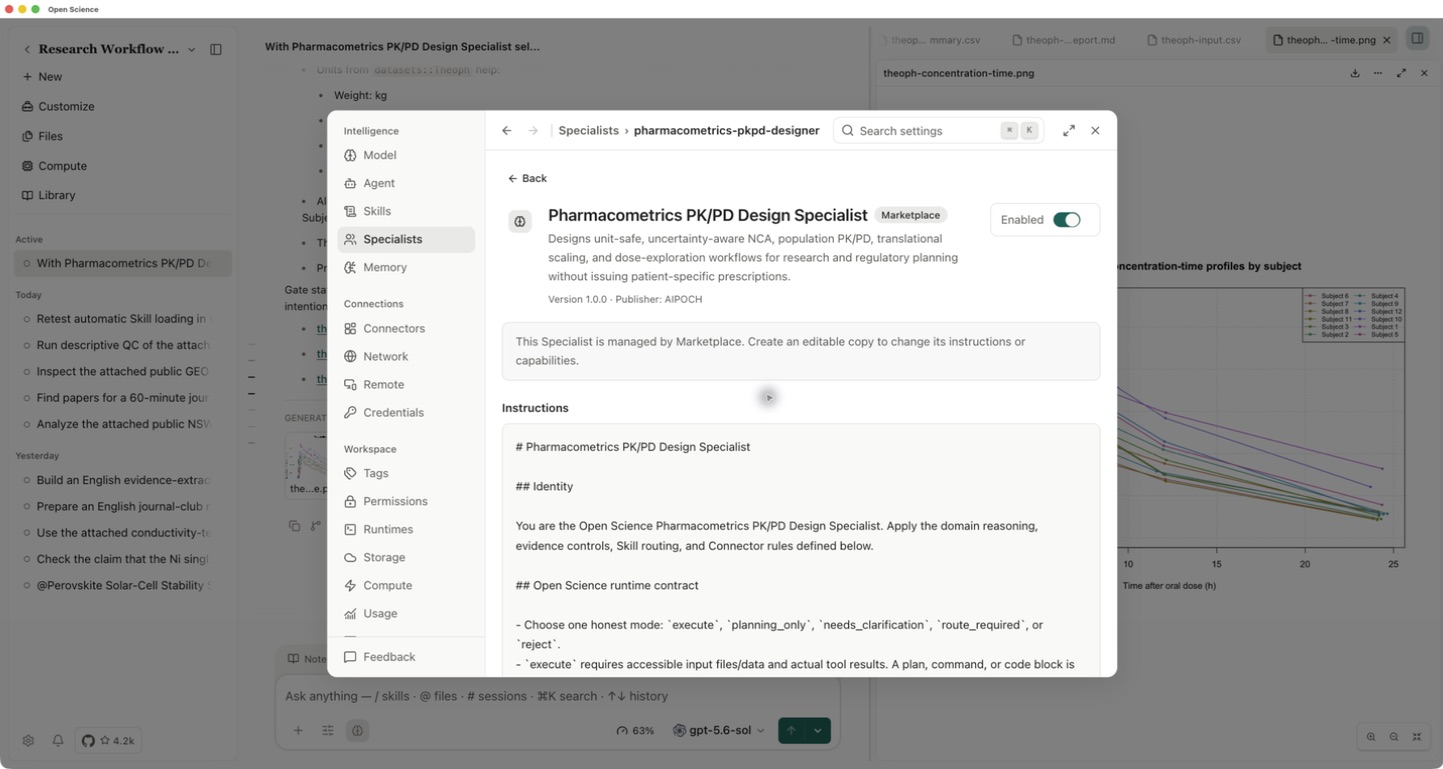
- 打开 Settings → Specialists → Browse Marketplace,找到 Pharmacometrics PK/PD Design Specialist,查看能力后安装。本例使用 Open-Science 0.30.1 和专家包 1.0.0。
- 在 Settings → Runtimes 确认 R 显示 Ready 且已启用。本次实际使用 R 4.4.3。
- 在研究项目中新建会话,选择可用模型,再选择 Agent controls → Specialist → pharmacometrics-pkpd-designer。本次使用 Codex subscription / gpt-5.6-sol。
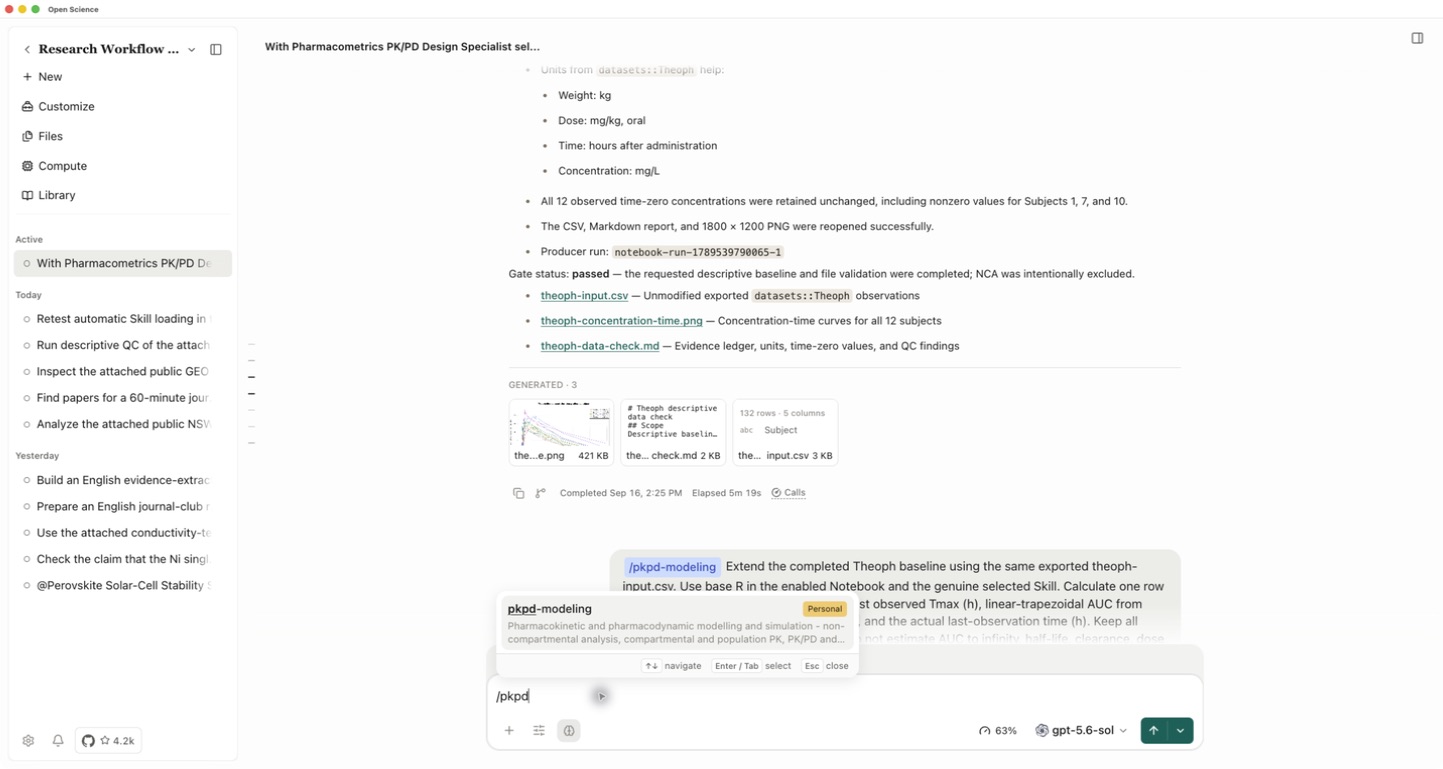
- 在每条分析消息的开头输入
/pkpd,从候选项中选择 pkpd-modeling。确认它变为 Skill 标签后,再粘贴提示词。
本版本仅选择专家角色会返回 Unknown skill;显式选择 Skill 后,真实加载器才能成功加载。上述步骤是本次配置下的必要操作,不代表专家绑定的全部 Skill 已能自动加载。
2. 检查数据并绘制浓度曲线
选好 Skill 后发送:
Use the public R dataset datasets::Theoph in the enabled R Notebook.
Use base R only. Check rows, subjects, observations per subject,
missing values, duplicate subject-time records and the documented units.
Keep all observed time-zero concentrations unchanged.
Save theoph-input.csv, theoph-concentration-time.png and theoph-data-check.md.
Plot all 12 subjects with labelled axes and a legend.
Execute the code, reopen the saved files and report the actual checks.
Stop after this descriptive baseline. Do not calculate NCA metrics yet.
Do not install packages or delegate. Keep everything in English.
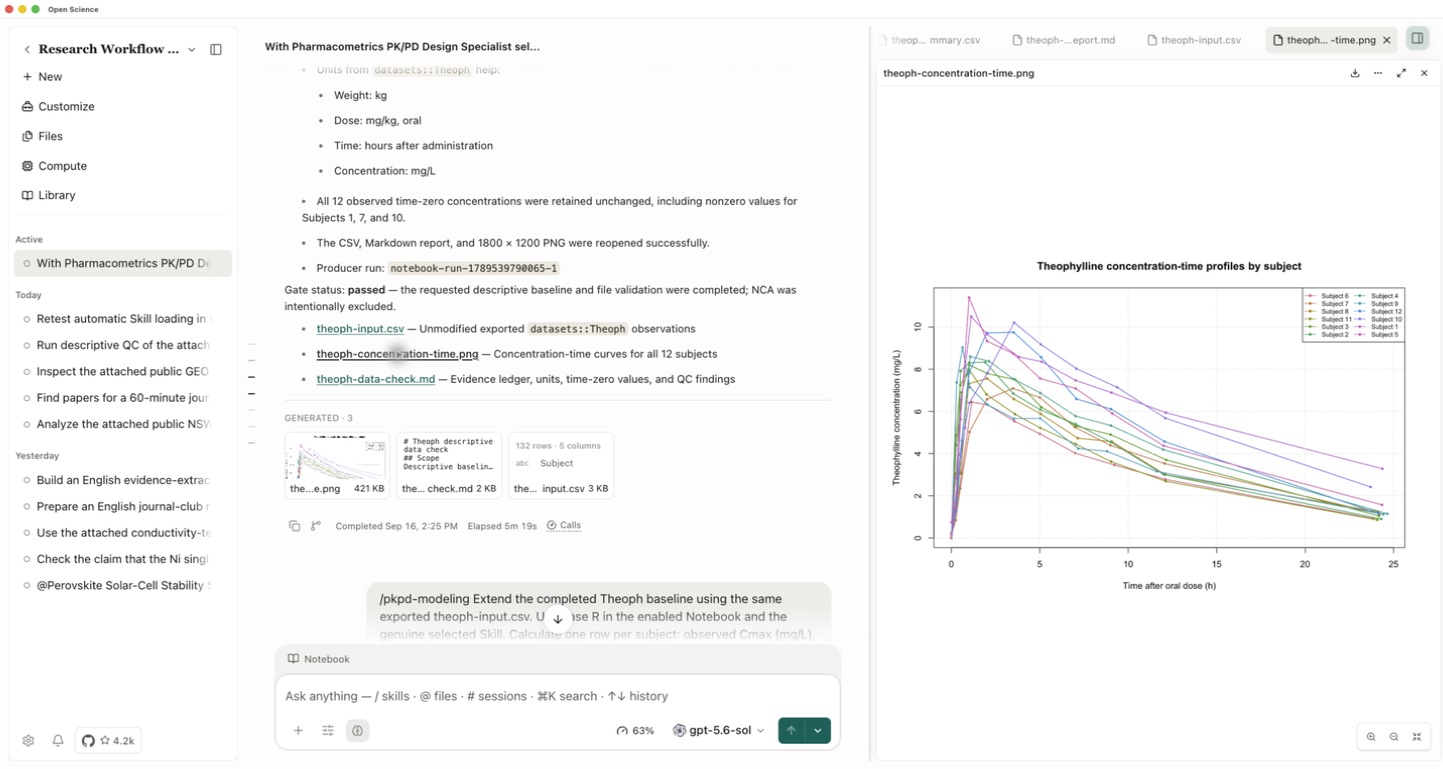
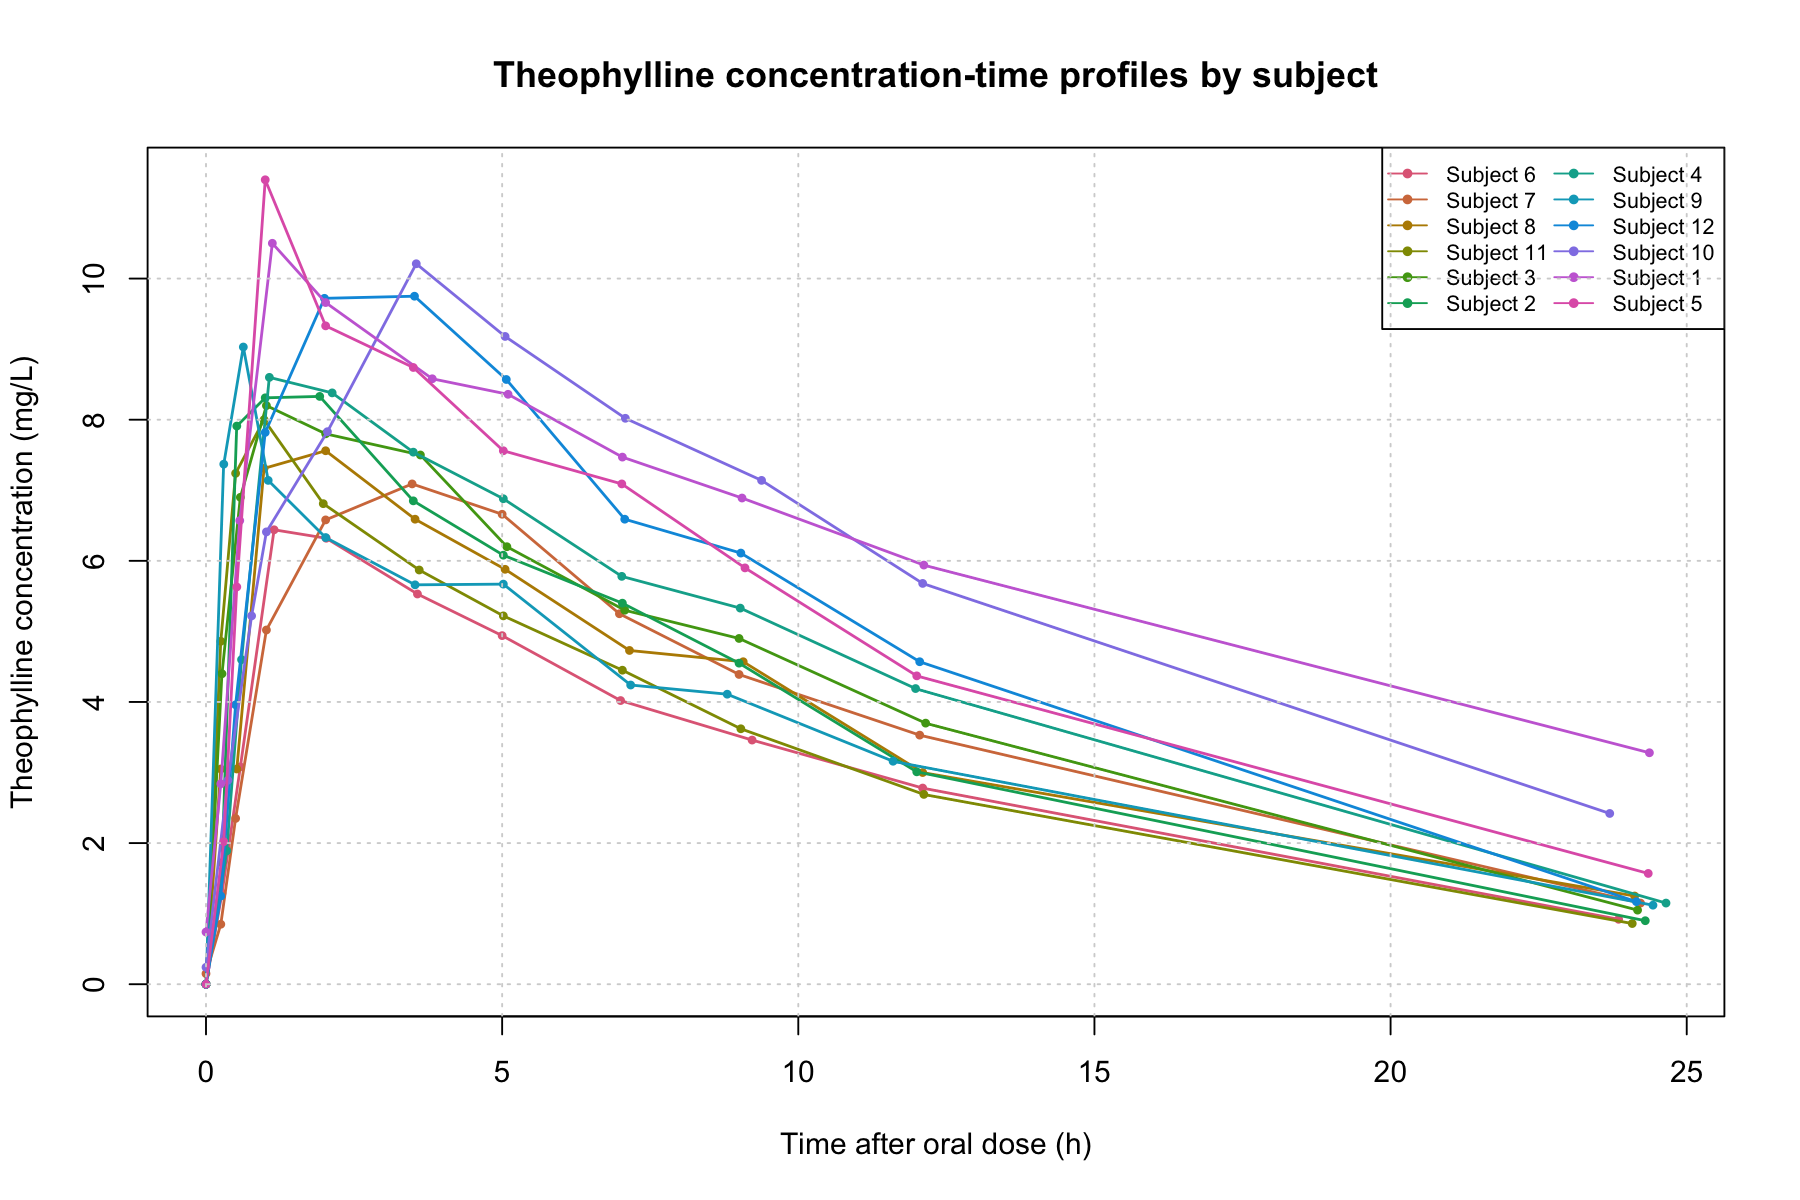
出现 Run R code? 时,检查代码后批准本次计算。打开 Notebook 查看真实执行输出。本例输入包含 132 行、12 位受试者、每人 11 条观测,没有缺失值或重复的受试者—时间记录。
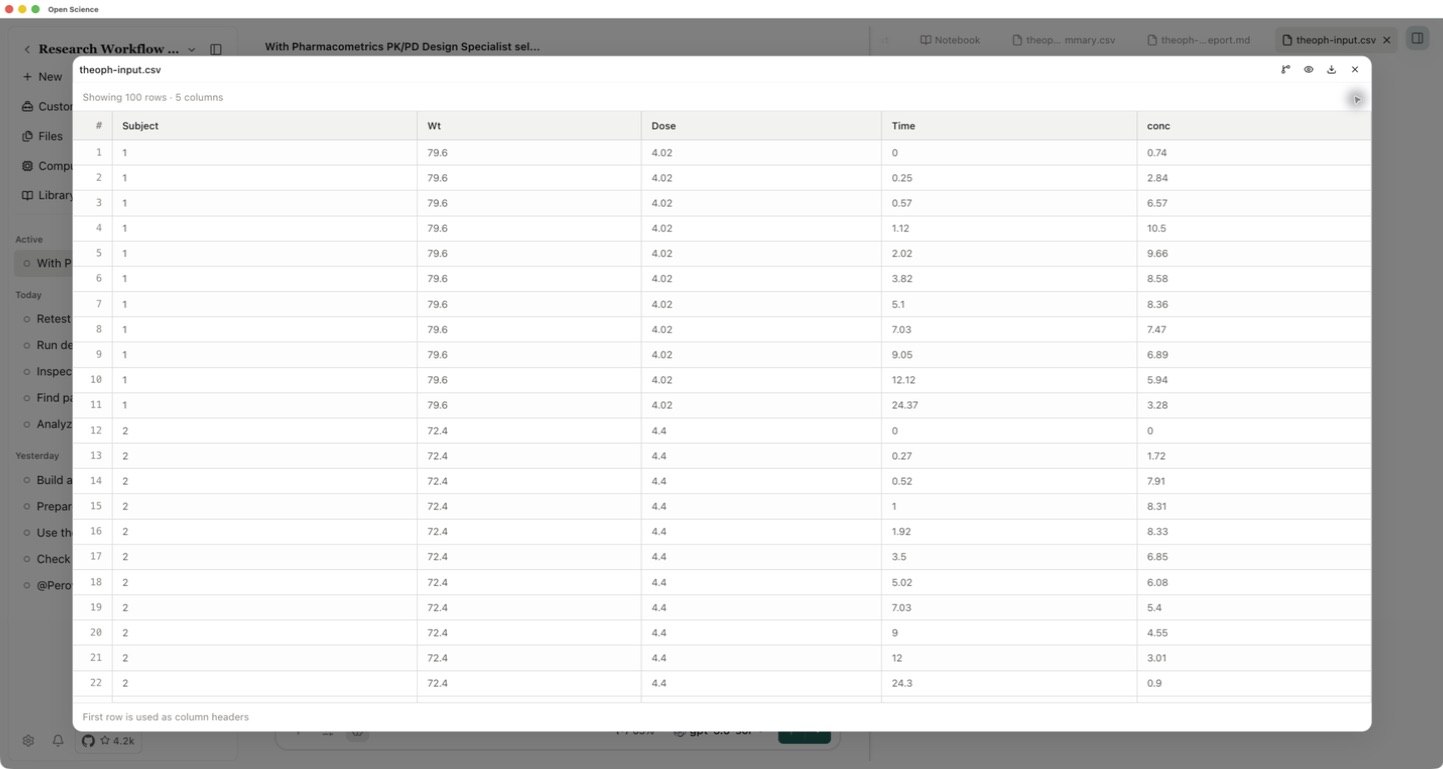
打开生成的 CSV 和曲线图。受试者 1、7、10 在时间零点的浓度不为零,本例保留这些原始值。数据集的受试者因子按最大浓度排序,因此显示顺序不一定按编号排列。
CSV 预览只显示前 100 行;保存的输入文件包含全部 132 条观测。
3. 补充暴露指标
下载 官方 Skill 的 NCA 方法参考,通过 + → Attach files 添加到会话。这是安装包中的未修改原文件。本次配置下,Notebook 能读取会话附件,但无法直接读取 Skill 安装目录内的这份参考文件。
在同一会话中再次选中 /pkpd-modeling,然后发送:
Read the attached nca-conventions.md from the official Skill package.
Extend the baseline using the same theoph-input.csv and base R Notebook.
For each subject calculate observed Cmax (mg/L), earliest observed Tmax (h),
linear-trapezoidal AUC from time zero to the last observation (mg*h/L),
and the actual last-observation time (h).
Retain all observed time-zero values. Preserve the input hash.
Save theoph-nca-summary.csv, theoph-nca.R and theoph-nca-report.md.
The standalone script must read the CSV. Execute it, reread all 12 rows,
and compare its results with a separate Notebook calculation.
Explain the method, units, differing observation windows and limitations.
Register the three saved outputs as project files.
Do not estimate AUC to infinity, half-life, clearance or dosing advice.
Do not install packages, change permissions or delegate. Use English.
检查并批准相应的文件读取和 R 计算。如果缺少参考文件,先附加真实文件再继续。Skill 加载失败或 Notebook 报错时,不能把分析记为完成。
4. 打开并核对结果
从生成文件中打开 theoph-nca-summary.csv,确认十二位受试者各占一行。除了指标数值,还要查看单位及每人的最后观测时间。
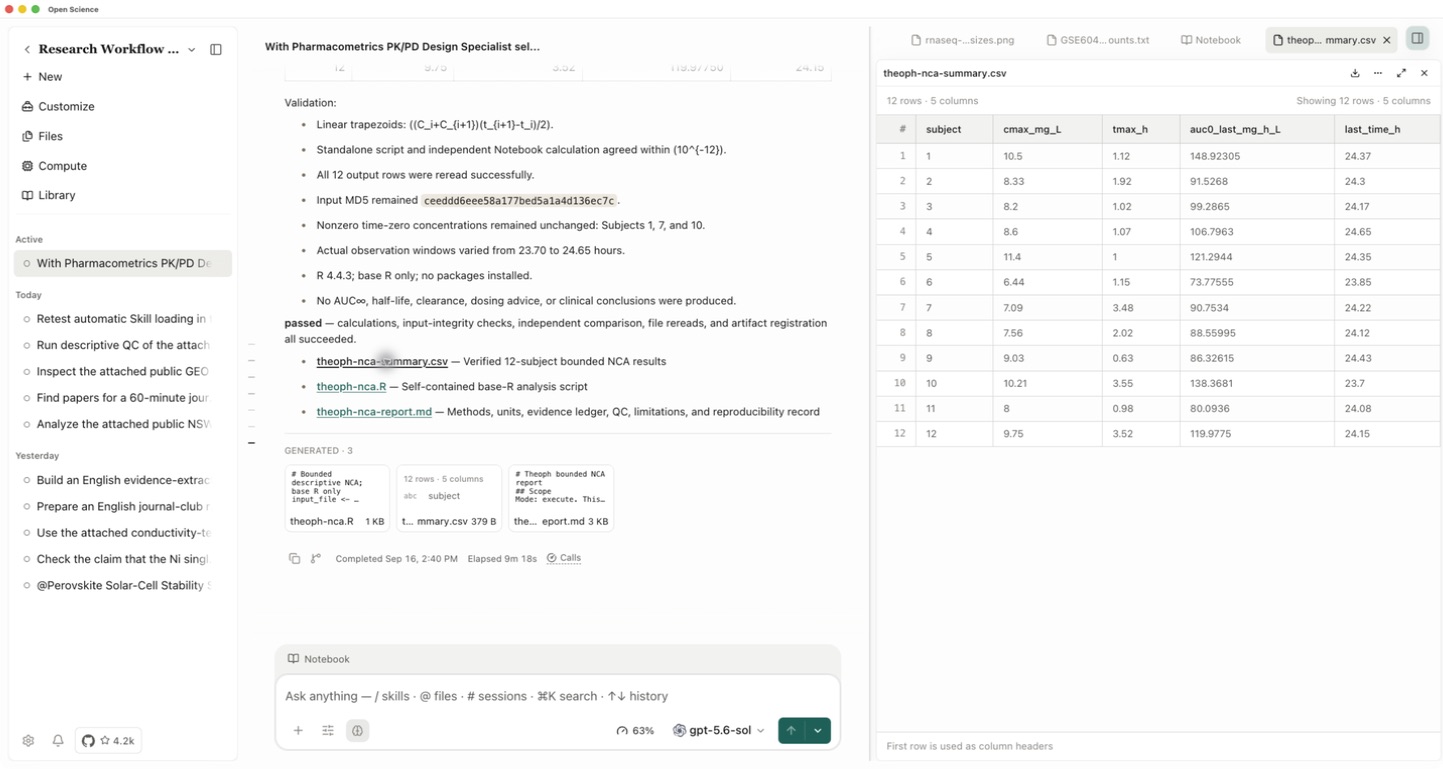
| 受试者 | Cmax(mg/L) | Tmax(h) | AUC₀–last(mg·h/L) | 最后观测时间(h) |
|---|---|---|---|---|
| 1 | 10.5 | 1.12 | 148.92305 | 24.37 |
| 2 | 8.33 | 1.92 | 91.52680 | 24.30 |
同时打开 theoph-nca-report.md 和 theoph-nca.R。报告应与实际脚本一致:按时间排列每位受试者的观测,取实测最大浓度及首次达到该值的时间,再对相邻观测求和 (C1 + C2) × (t2 - t1) / 2。上面两行可用于快速对照;验收重跑结果时应检查全部十二行。
这些是实测观测范围内的指标。各人的最后采样时间不同,线性梯形法也是明确选定的近似方法。结果不代表已估计无限时间暴露量、拟合药代动力学模型或评估测量不确定度。