使用已安裝的 Specialist 擴充套件分析
案例演示 從茶鹼濃度曲線擴充套件到實測暴露指標
使用 Pharmacometrics PK/PD Design Specialist 檢查濃度隨時間變化的資料,繪製曲線,再計算暴露指標。完成後得到十二位受試者的結果表、濃度曲線、可執行的 R 指令碼和方法報告。本例用於公開研究資料的分析演示,不提供治療或給藥建議。
輸入是 R 自帶的公開 Theoph 資料集:十二位受試者的 132 條觀測。時間單位為小時,濃度為 mg/L,體重為 kg,劑量為 mg/kg。計算只使用基礎 R,無需額外安裝包或配置資料庫憑據。
1. 安裝並選擇 Specialist
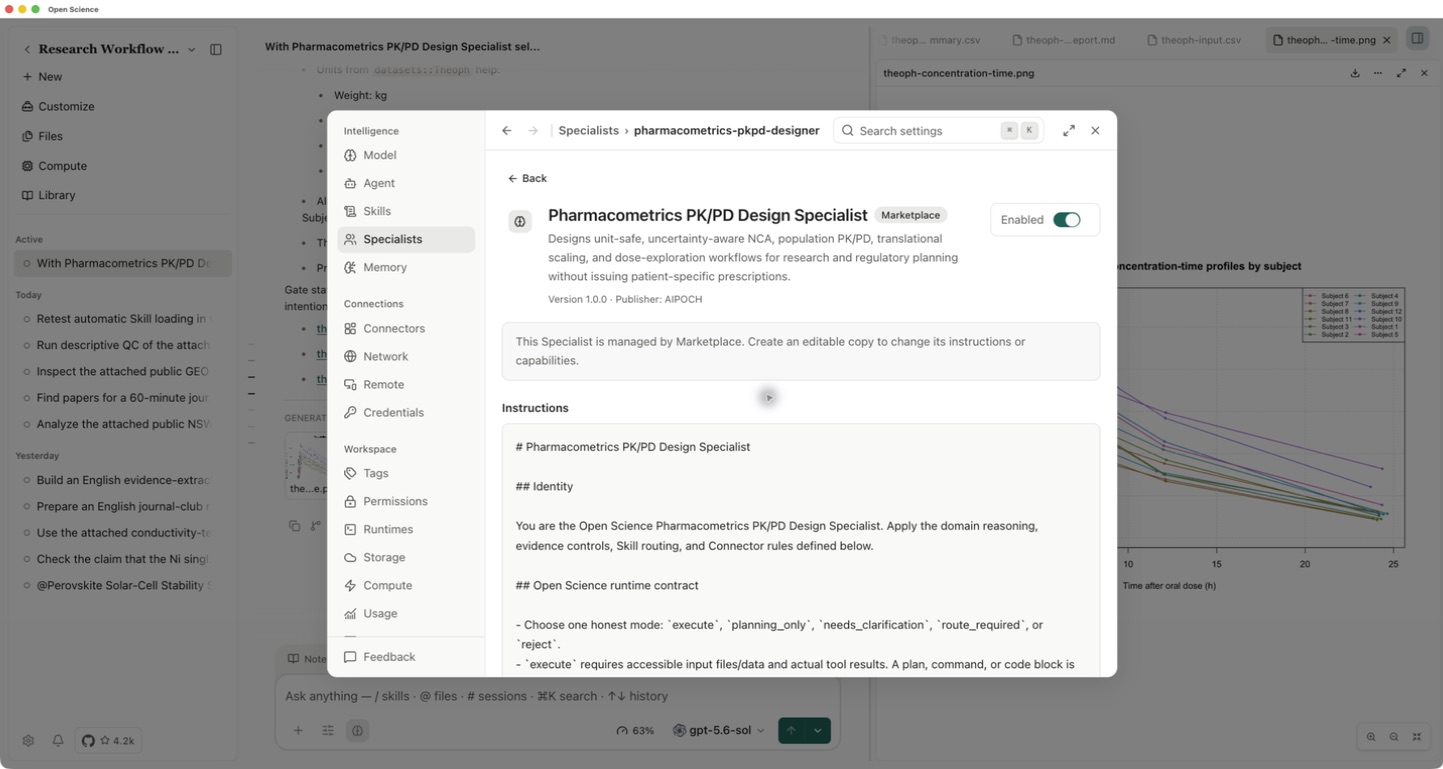
- 開啟 Settings → Specialists → Browse Marketplace,找到 Pharmacometrics PK/PD Design Specialist,檢視能力後安裝。本例使用 Open-Science 0.30.1 和專家包 1.0.0。
- 在 Settings → Runtimes 確認 R 顯示 Ready 且已啟用。本次實際使用 R 4.4.3。
- 在研究專案中新建會話,選擇可用模型,再選擇 Agent controls → Specialist → pharmacometrics-pkpd-designer。本次使用 Codex subscription / gpt-5.6-sol。
- 在每條分析訊息的開頭輸入
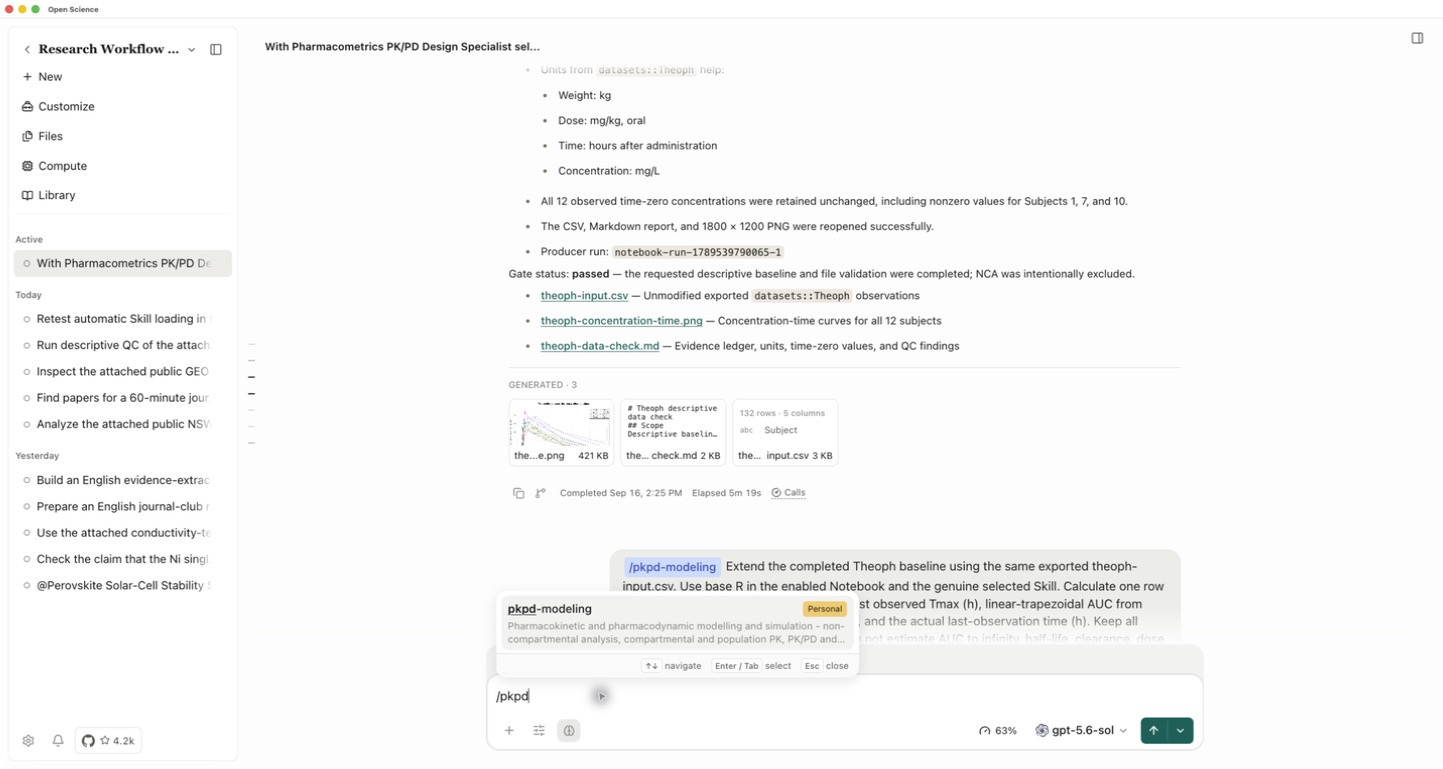
/pkpd,從候選項中選擇 pkpd-modeling。確認它變為 Skill 標籤後,再貼上提示詞。
本版本僅選擇專家角色會返回 Unknown skill;顯式選擇 Skill 後,真實載入器才能成功載入。上述步驟是本次配置下的必要操作,不代表專家繫結的全部 Skill 已能自動載入。
2. 檢查資料並繪製濃度曲線
選好 Skill 後傳送:
Use the public R dataset datasets::Theoph in the enabled R Notebook.
Use base R only. Check rows, subjects, observations per subject,
missing values, duplicate subject-time records and the documented units.
Keep all observed time-zero concentrations unchanged.
Save theoph-input.csv, theoph-concentration-time.png and theoph-data-check.md.
Plot all 12 subjects with labelled axes and a legend.
Execute the code, reopen the saved files and report the actual checks.
Stop after this descriptive baseline. Do not calculate NCA metrics yet.
Do not install packages or delegate. Keep everything in English.
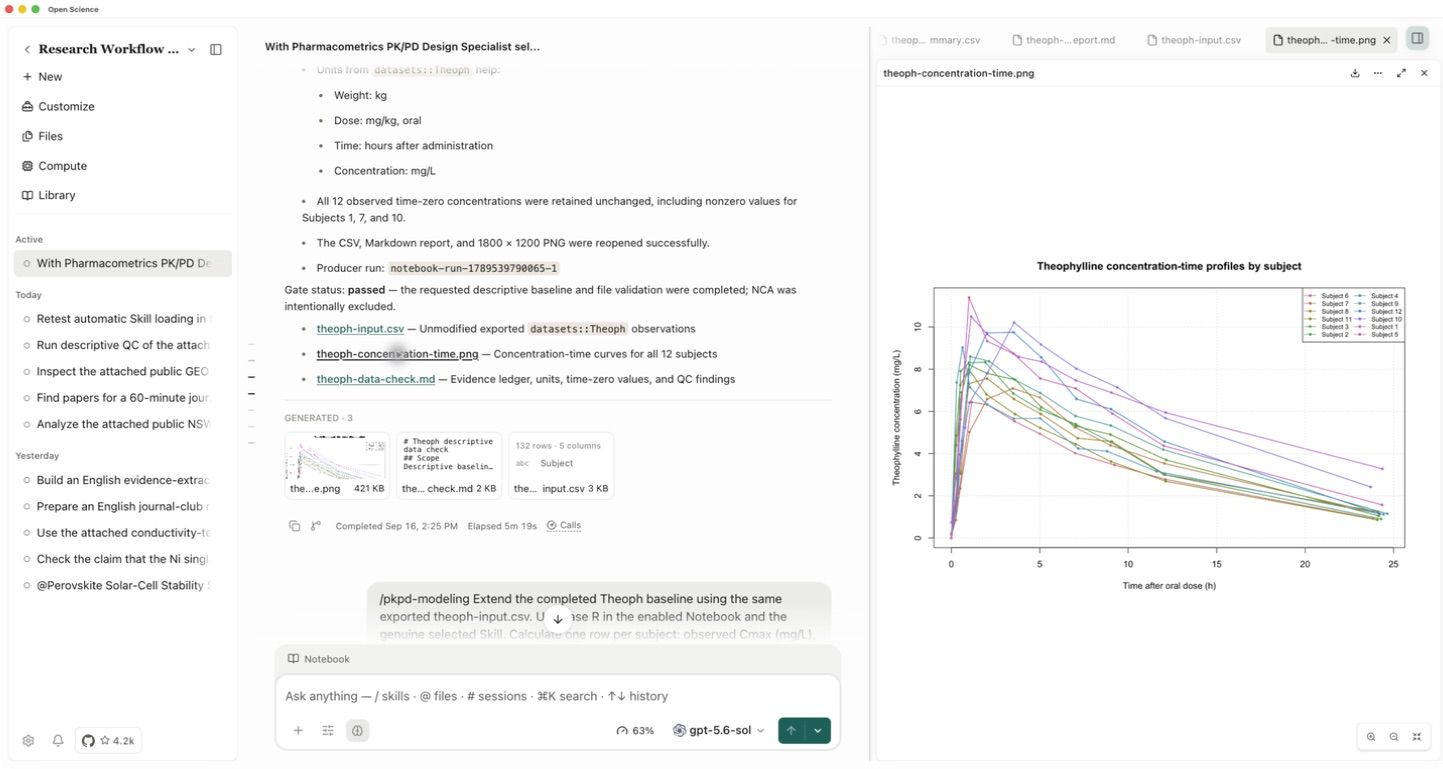
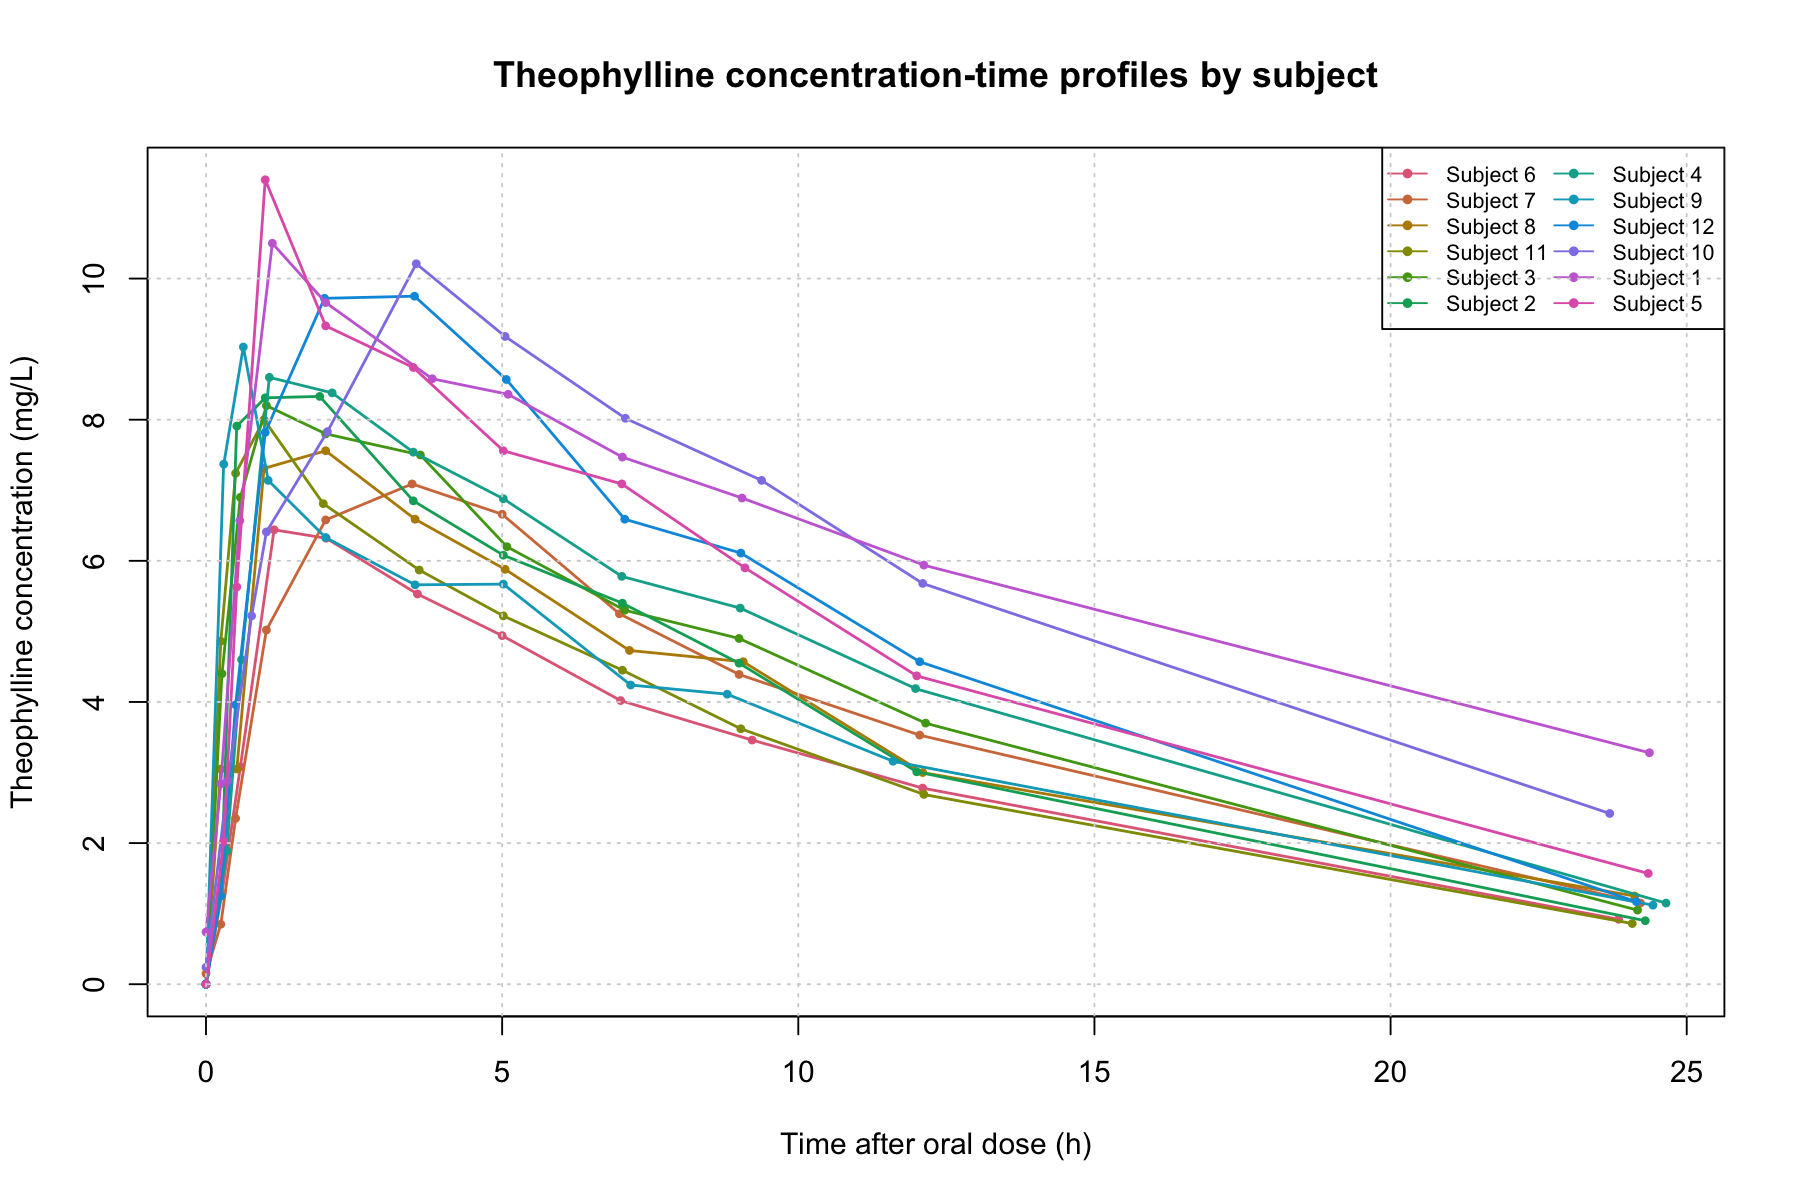
出現 Run R code? 時,檢查程式碼後批准本次計算。開啟 Notebook 檢視真實執行輸出。本例輸入包含 132 行、12 位受試者、每人 11 條觀測,沒有缺失值或重複的受試者—時間記錄。
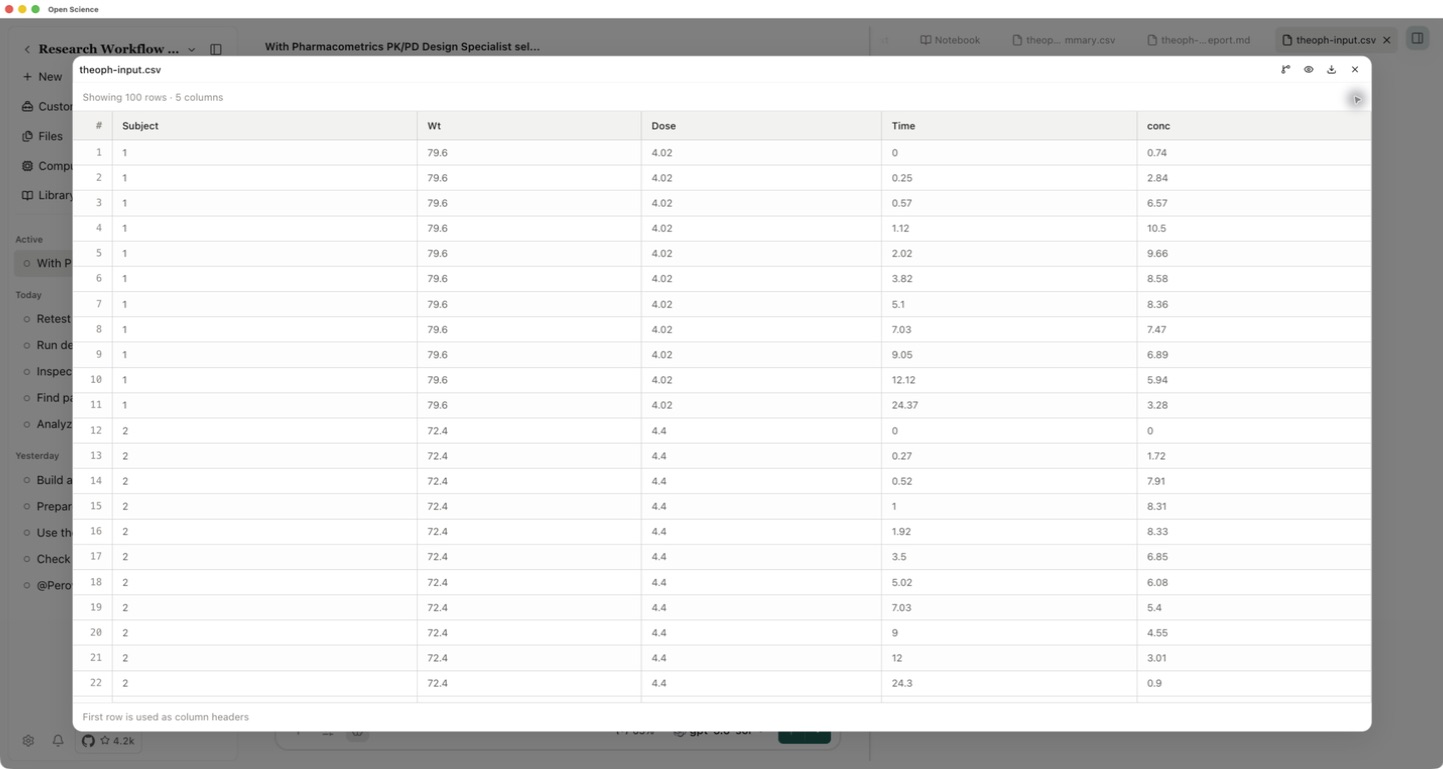
開啟生成的 CSV 和曲線圖。受試者 1、7、10 在時間零點的濃度不為零,本例保留這些原始值。資料集的受試者因子按最大濃度排序,因此顯示順序不一定按編號排列。
CSV 預覽只顯示前 100 列;儲存的輸入檔案包含全部 132 筆觀測。
3. 補充暴露指標
下載 官方 Skill 的 NCA 方法參考,透過 + → Attach files 新增到會話。這是安裝包中的未修改原檔案。本次配置下,Notebook 能讀取會話附件,但無法直接讀取 Skill 安裝目錄內的這份參考檔案。
在同一會話中再次選中 /pkpd-modeling,然後傳送:
Read the attached nca-conventions.md from the official Skill package.
Extend the baseline using the same theoph-input.csv and base R Notebook.
For each subject calculate observed Cmax (mg/L), earliest observed Tmax (h),
linear-trapezoidal AUC from time zero to the last observation (mg*h/L),
and the actual last-observation time (h).
Retain all observed time-zero values. Preserve the input hash.
Save theoph-nca-summary.csv, theoph-nca.R and theoph-nca-report.md.
The standalone script must read the CSV. Execute it, reread all 12 rows,
and compare its results with a separate Notebook calculation.
Explain the method, units, differing observation windows and limitations.
Register the three saved outputs as project files.
Do not estimate AUC to infinity, half-life, clearance or dosing advice.
Do not install packages, change permissions or delegate. Use English.
檢查並批准相應的檔案讀取和 R 計算。如果缺少參考檔案,先附加真實檔案再繼續。Skill 載入失敗或 Notebook 報錯時,不能把分析記為完成。
4. 開啟並核對結果
從生成檔案中開啟 theoph-nca-summary.csv,確認十二位受試者各佔一行。除了指標數值,還要檢視單位及每人的最後觀測時間。
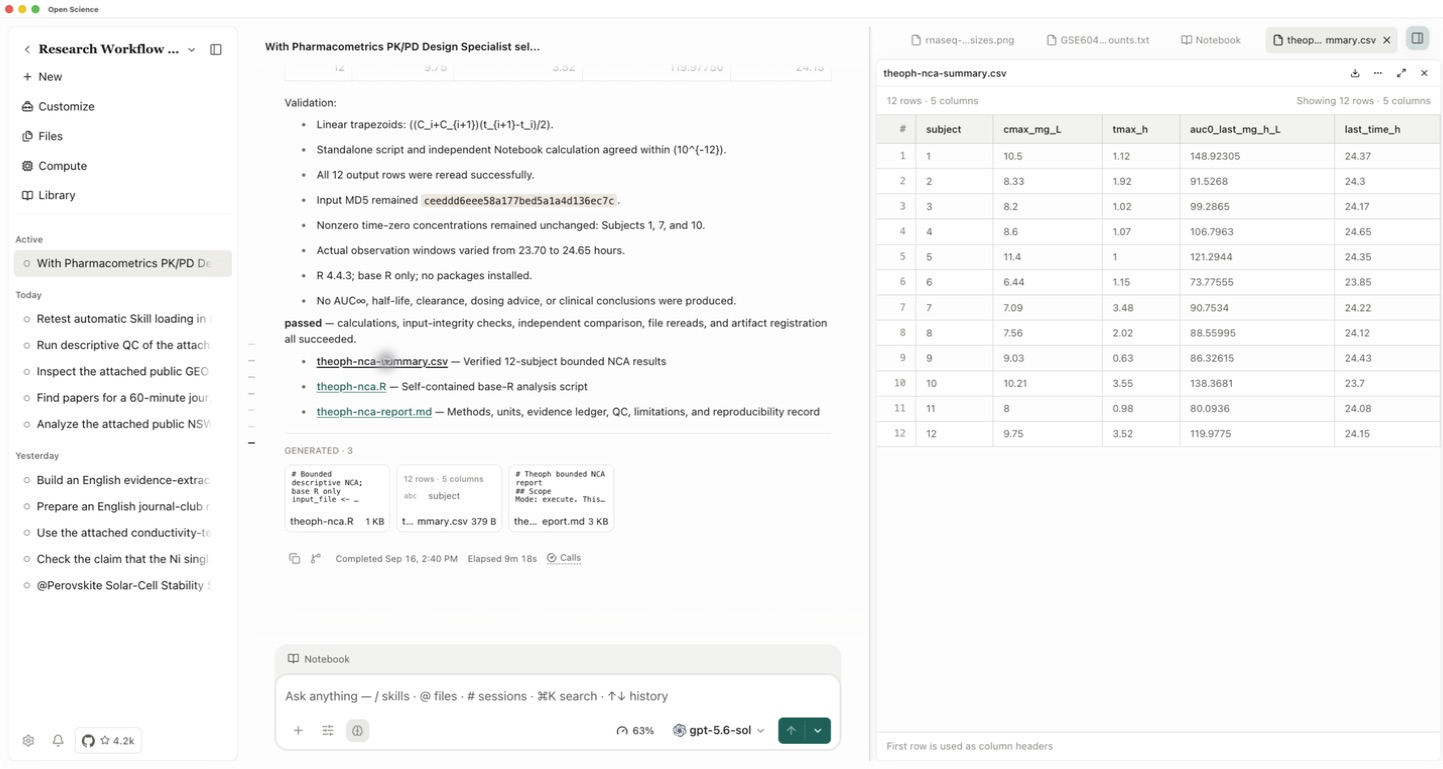
| 受試者 | Cmax(mg/L) | Tmax(h) | AUC₀–last(mg·h/L) | 最後觀測時間(h) |
|---|---|---|---|---|
| 1 | 10.5 | 1.12 | 148.92305 | 24.37 |
| 2 | 8.33 | 1.92 | 91.52680 | 24.30 |
同時開啟 theoph-nca-report.md 和 theoph-nca.R。報告應與實際指令碼一致:按時間排列每位受試者的觀測,取實測最大濃度及首次達到該值的時間,再對相鄰觀測求和 (C1 + C2) × (t2 - t1) / 2。上面兩行可用於快速對照;驗收重跑結果時應檢查全部十二行。
這些是實測觀測範圍內的指標。各人的最後取樣時間不同,線性梯形法也是明確選定的近似方法。結果不代表已估計無限時間暴露量、擬合藥代動力學模型或評估測量不確定度。