Check sample quality in a gene-count matrix
Worked example Check sample quality in GSE60450
Before running differential-expression analysis, check that the count matrix is structurally usable and that sample labels remain traceable. This walkthrough uses the real public GEO GSE60450 mouse mammary RNA-seq matrix. It produces a twelve-sample QC table, a raw library-size plot and a methods report in Open-Science.
Research decision: is the file internally consistent enough to proceed to sample annotation and a separately designed statistical analysis? The checks below address file integrity and descriptive counts. They do not establish biological comparability, normalization, batch correction or differential expression.
The dimensions and numerical results below belong to this example input. With your own matrix, define its sample columns and recompute the checks.
Source and input contract
Download the original matrix from Example data and expected results. Check its checksum, sample columns and metadata fields before uploading it. Use that page for the baseline values throughout this workflow.
1. Define the work before running it
Create a project and attach the original matrix from the example page. Enable Python with csv, statistics and hashlib (standard library) and install matplotlib through Runtimes if it is absent. Use a connected model that can execute Notebook code.
Send this request, or adapt the output names while preserving the column definitions:
Inspect the attached public GEO GSE60450 gene-count matrix in the Session
Notebook using Python csv/statistics/hashlib and matplotlib. Do not install
packages during the analysis. Preserve the input. Exclude EntrezGeneID and
Length from the 12 sample-count columns. Validate unique IDs, row widths,
nonnegative integer counts and missing entries. Save rnaseq-sample-qc.csv
with exactly six columns: compact_sample, original_column_name, total_raw_counts,
zero_count_genes, detected_genes_count_gt_0, median_count_among_detected_genes. Retain the complete original sample
identifier in original_column_name; compact_sample is only a compact display label.
For each sample compute the raw-count sum, count of zeros, count > 0,
and median of positive counts. Save rnaseq-library-sizes.png with all sample
labels and a raw-count axis, plus rnaseq-qc-report.md describing the source,
input SHA-256 before and after, method, label mapping and limitations.
Save all three outputs in English; I will reopen them to check the results.
Do not perform differential-expression testing or delegate.
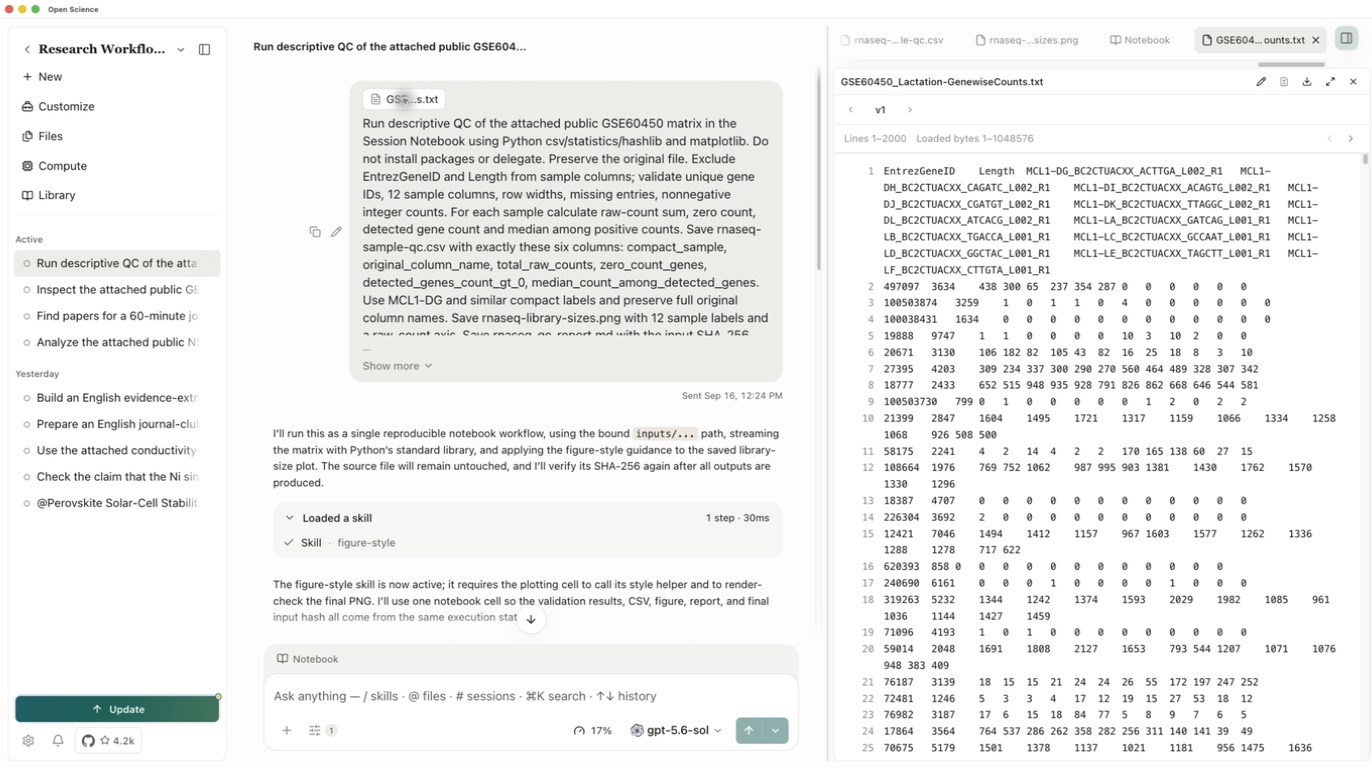
Before sending, click the attachment to check its header: two metadata columns followed by twelve sample columns. The text preview loads only part of a large file; the Notebook must read the entire matrix. This run sent the calculation directly. If you want to agree on a plan first, use the separate Planning flow.
2. Keep metadata out of sample calculations
The calculation preserves Entrez IDs, verifies consistent row widths and checks counts as nonnegative integers. Length is gene metadata, not a thirteenth sample. A zero count is a measured entry, not a missing value; do not replace blanks with zero or remove zero-count genes silently.
For each sample, compute total raw counts, number of zero-count genes, number with count greater than zero, and the median count among detected genes only. Record that denominator. Use the exact input columns; compact labels such as MCL1-DG are display labels with an explicit mapping, not newly inferred biological groups.
3. Inspect the execution and handle a failure
Read the Python permission request, including the input file and output names, then allow the scoped operation. Open Notebook in the conversation and inspect the completed cell and its output. Check the dimensions, original labels, metric arrays and before/after hash; the model's completion message alone is insufficient.
If the input Version ID cannot be resolved, ask the Agent to use the input mounted from this conversation's attachment and retry. This run used that recovery. Do not treat the failed attempt as a completed calculation or silently substitute another file.
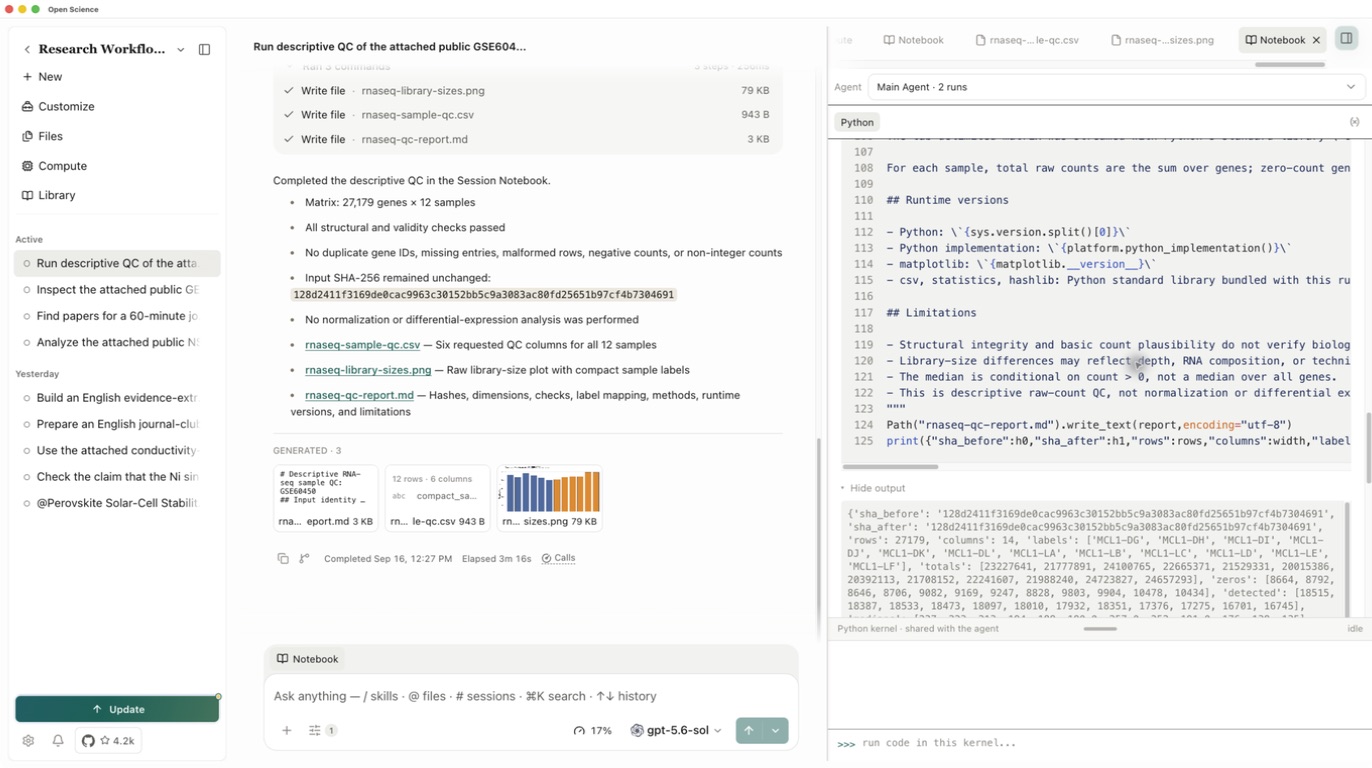
The completed rerun validated 27,179 gene rows and 12 sample columns with no malformed rows, duplicate IDs, missing entries or invalid counts. All three requested files appeared under Generated. Open each file there; a working file that was never saved as an artifact is not yet a deliverable.
4. Accept the sample table
Open rnaseq-sample-qc.csv and check 12 rows · 6 columns. It retains each full original column name. The table below lists all four metrics; the downloadable CSV includes the mapping column.
Compare all sample metrics with the baseline table, matching rows by the complete sample identifier.
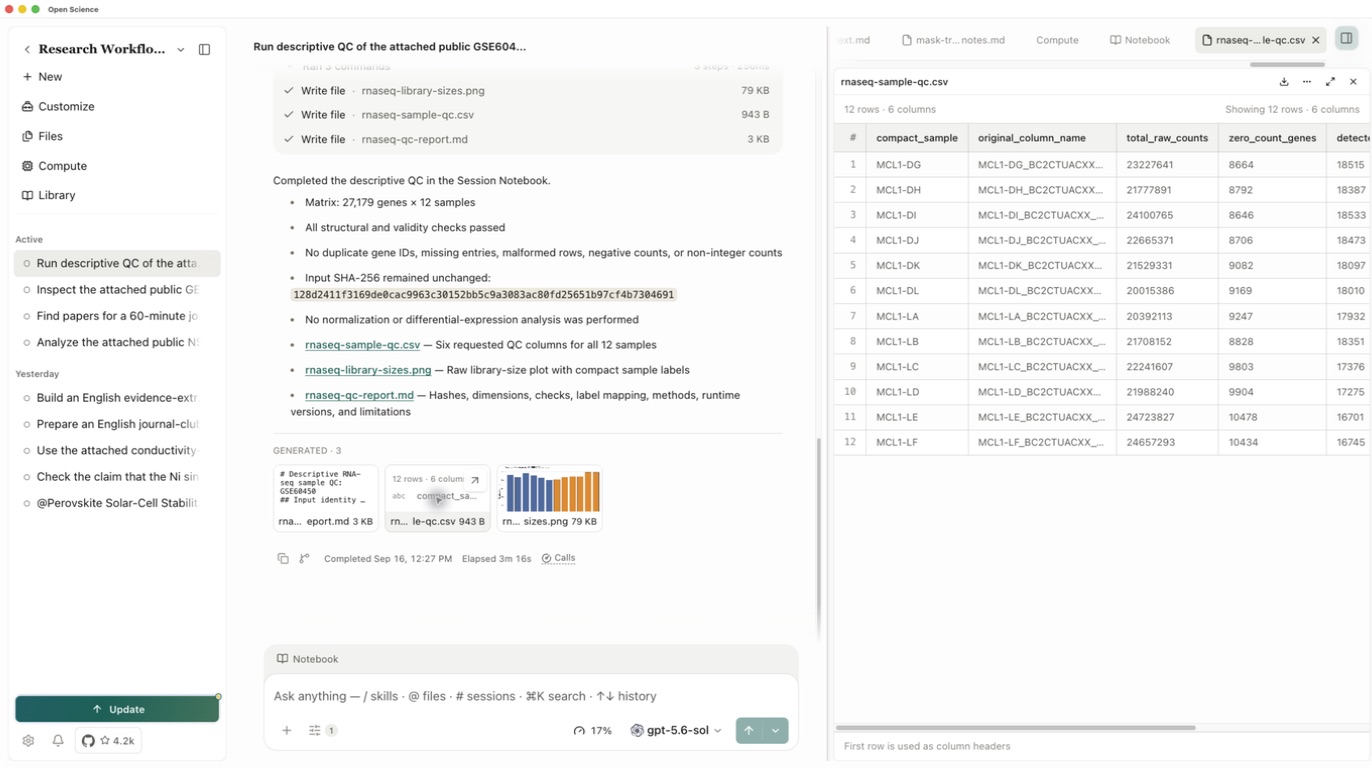
For this input, zero-count plus detected genes in each row should equal 27,179. Compare the 48 sample metrics with the independent baseline. Agreement checks these calculations for the supplied input; downstream assumptions still need their own assessment.
5. Read the plot without overinterpreting it
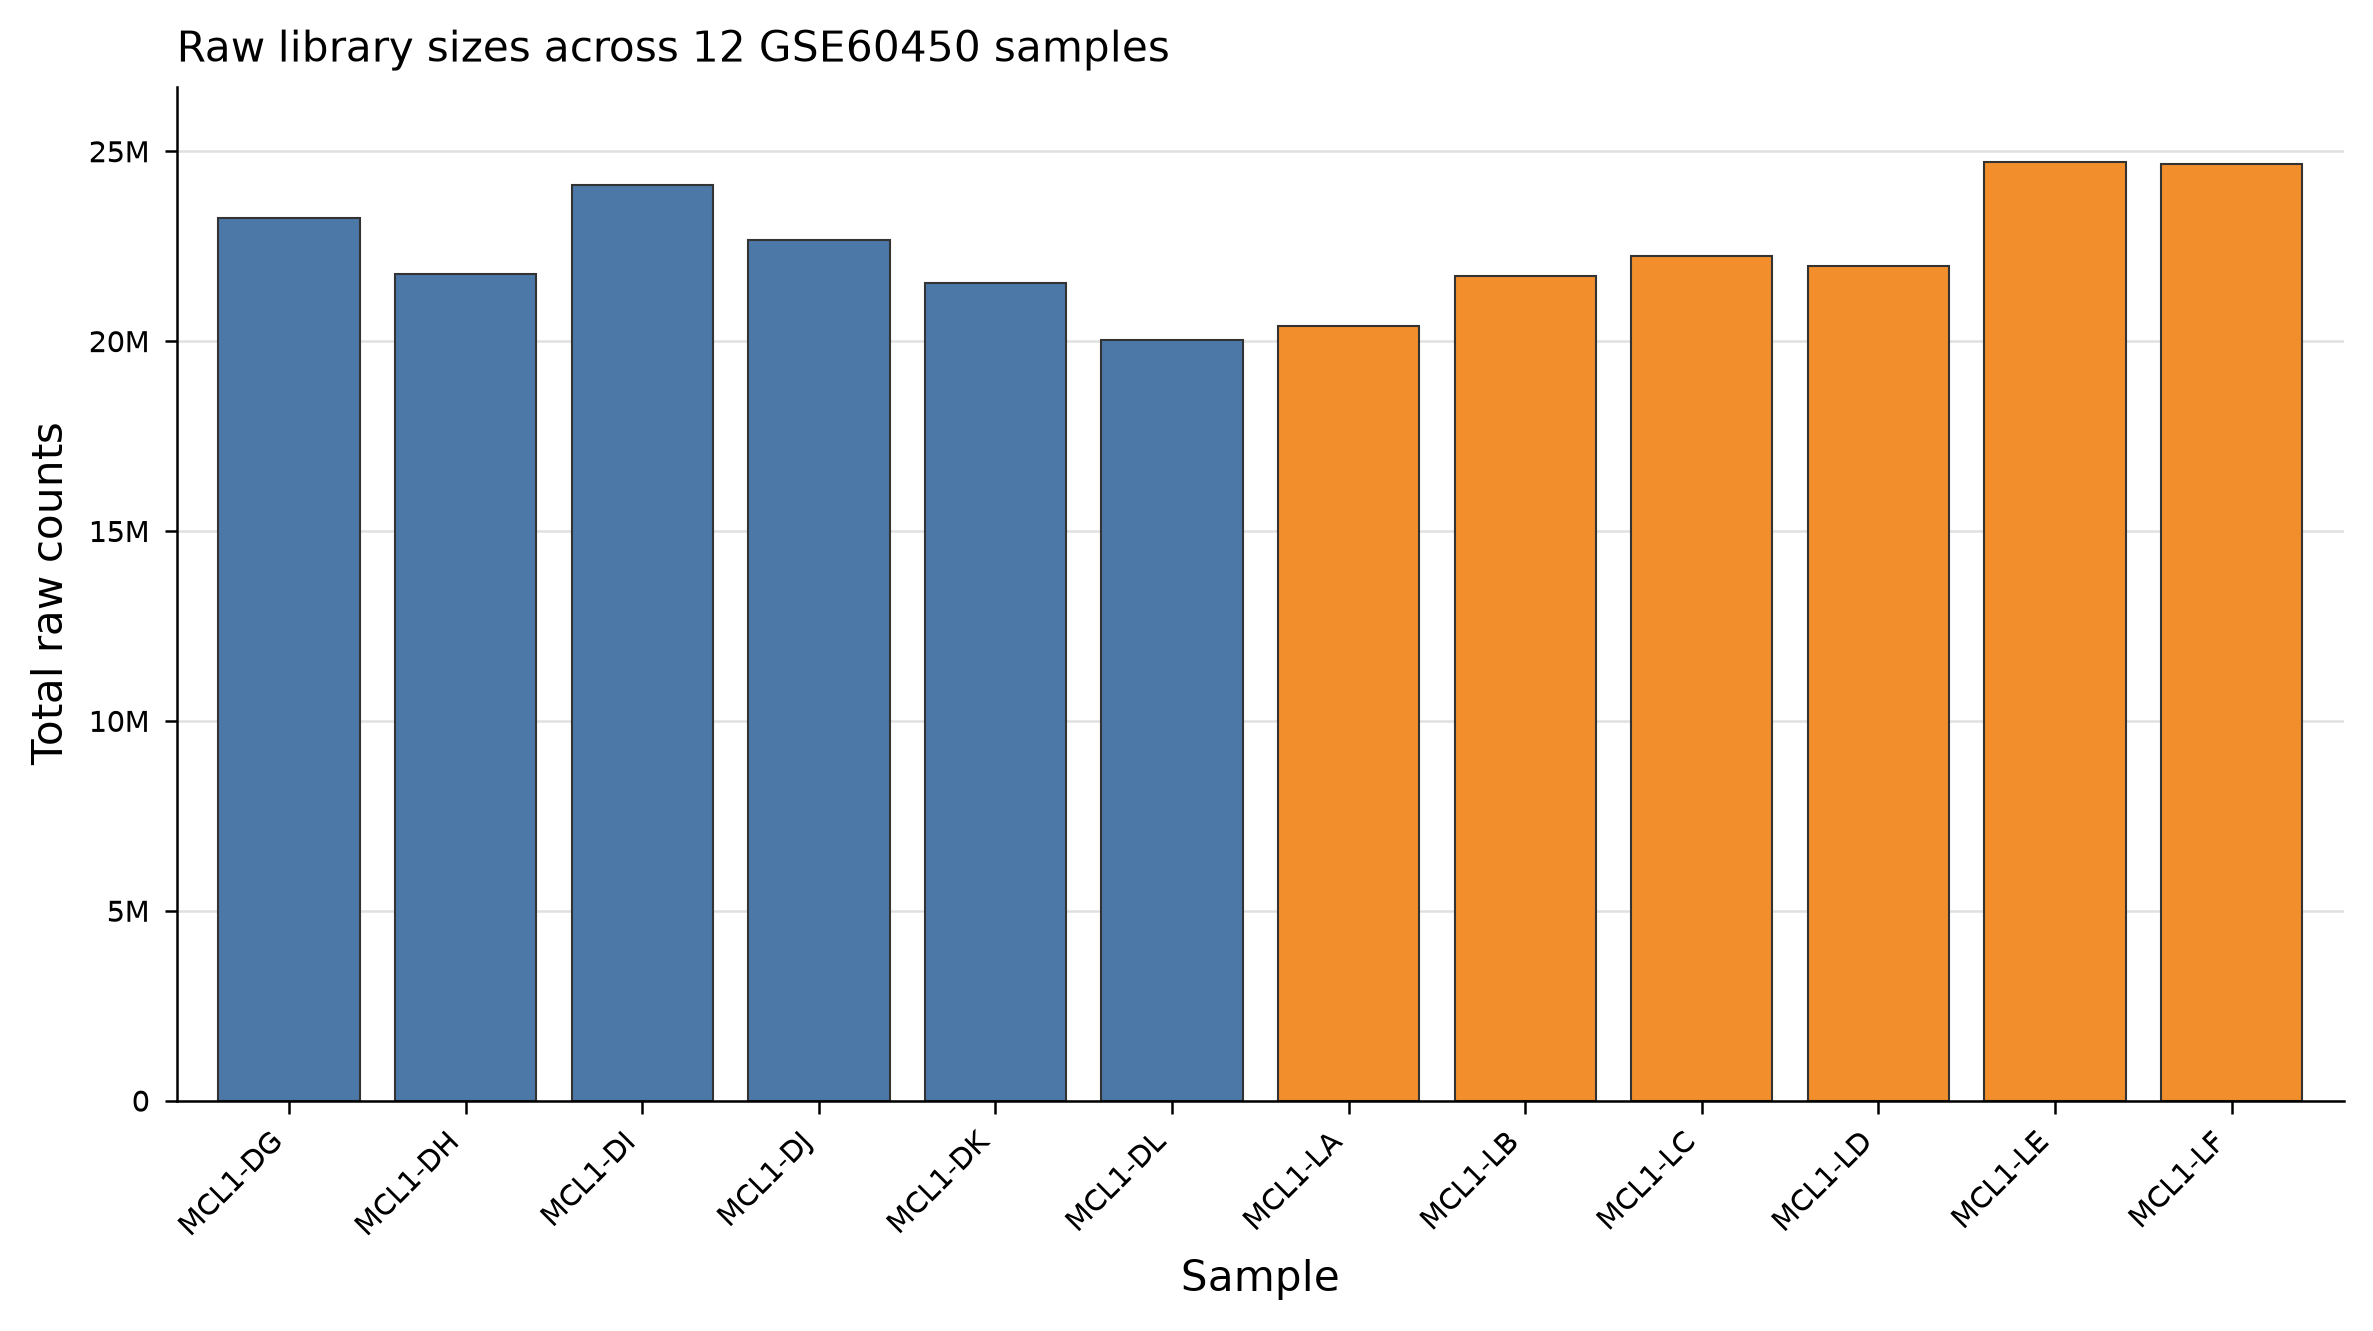
Open rnaseq-library-sizes.png and enlarge it. Check all twelve sample labels, the raw-count axis and the note that values are not normalized. Total counts range from 20,015,386 to 24,723,827 in this matrix.
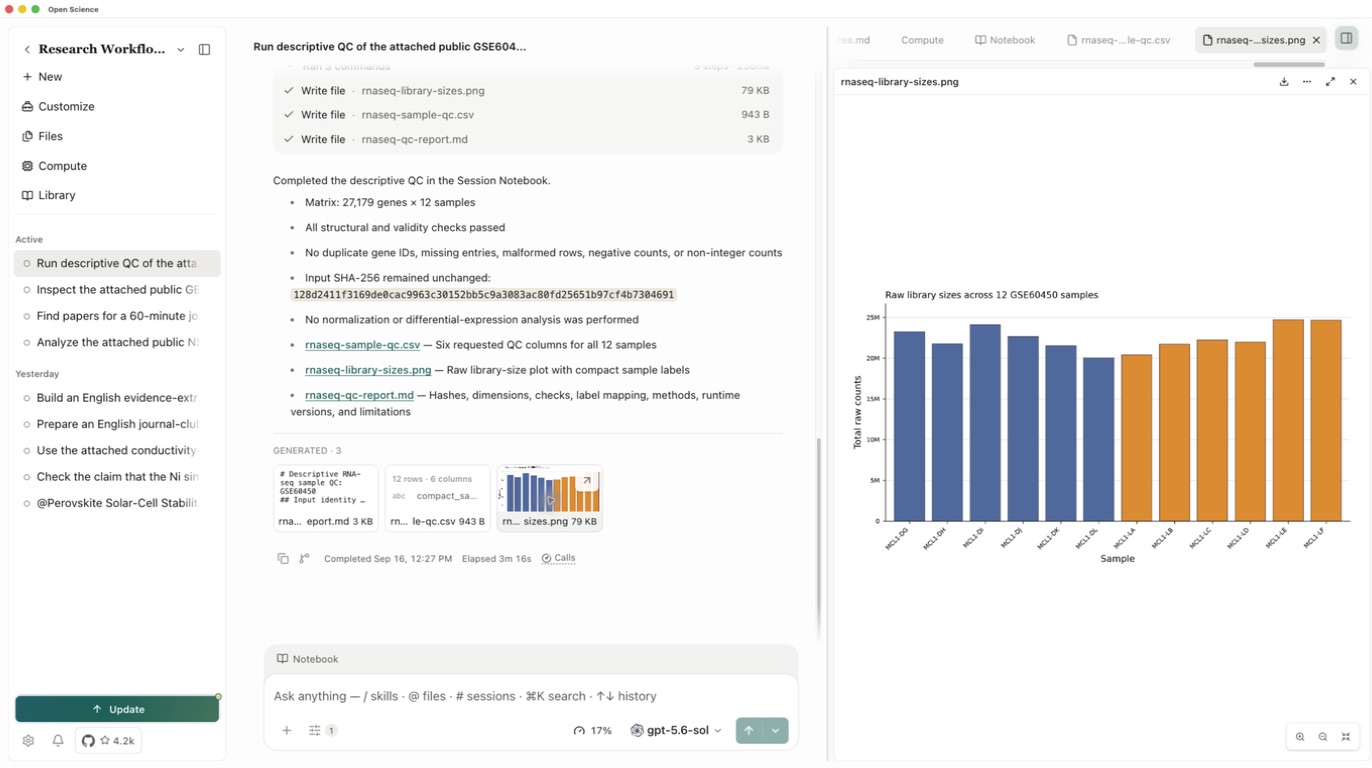
A larger library total does not by itself mean that a gene is differentially expressed. Before a separate downstream analysis, match sample characteristics to the GEO metadata and specify the design, contrasts, normalization and filtering rules. A separate Connector follow-up retrieved the twelve samples’ GEO characteristics; the GSM-to-matrix-column mapping, analysis design and statistical steps were not validated here. See Connectors.
6. Retain the methods and evidence
Keep a report containing the input checksum, dimensions, validity checks, exact label mapping, runtime/library versions and interpretation limits. Add an independent-check section only after comparing the values. Saving a report revision does not recompute the table or figure.
The September 16 rerun matched all 48 metrics against the independently checked baseline. Its input SHA-256 remained 128d2411f3169de0cac9963c30152bb5c9a3083ac80fd25651b97cf4b7304691. The report records Python 3.12.14 and matplotlib 3.11.1. These checks establish this calculation's agreement and input preservation; they do not establish a Reviewer audit or an exact environment for independent reproduction.
Download this rerun's QC table, plot and report. Retain the original input and the session Notebook too. The example-data page keeps the earlier baseline and Notebook exports separately; those exports are not the Notebook from this rerun. Use Reproducibility checks for a separate environment-and-rerun assessment.