Cross-check two scientific data sources
Worked example NASA GISTEMP and HadCRUT annual global temperature anomalies
Two sources can disagree because their definitions differ. Before interpreting a discrepancy, align the units, time interval and reference period. This example compares two real annual temperature datasets over 1980–2024, after rebasing each to 1991–2020. It saves an aligned table, a two-panel figure, a Python script and a methods report.
1. Obtain the source files and check their definitions
Download the annual land–ocean CSV from NASA GISTEMP v4 and the annual analysis ensemble-mean series from HadCRUT5.1.0.0. Use the saved filenames NASA-GISTEMP-v4-original.csv and HadCRUT5-original.csv.
| Input | Annual value | Original anomaly baseline |
|---|---|---|
| NASA GISTEMP v4 | J-D column, °C | 1951–1980 |
| HadCRUT5.1.0.0 | Annual ensemble mean, °C; retain confidence limits | 1961–1990 |
The NASA file starts with a descriptive line before its header and uses *** for unavailable values. Do not interpret that marker as zero. The recorded source identities and download links are in the example source notes; provider files can be revised after this run.
Open a project and attach both CSVs with + → Attach files. In Settings → Runtimes, ensure Python is Ready and enabled. This run used Python 3.12.14, NumPy 2.5.3, pandas 2.3.3, Matplotlib 3.11.1 and Pillow 12.3.0.
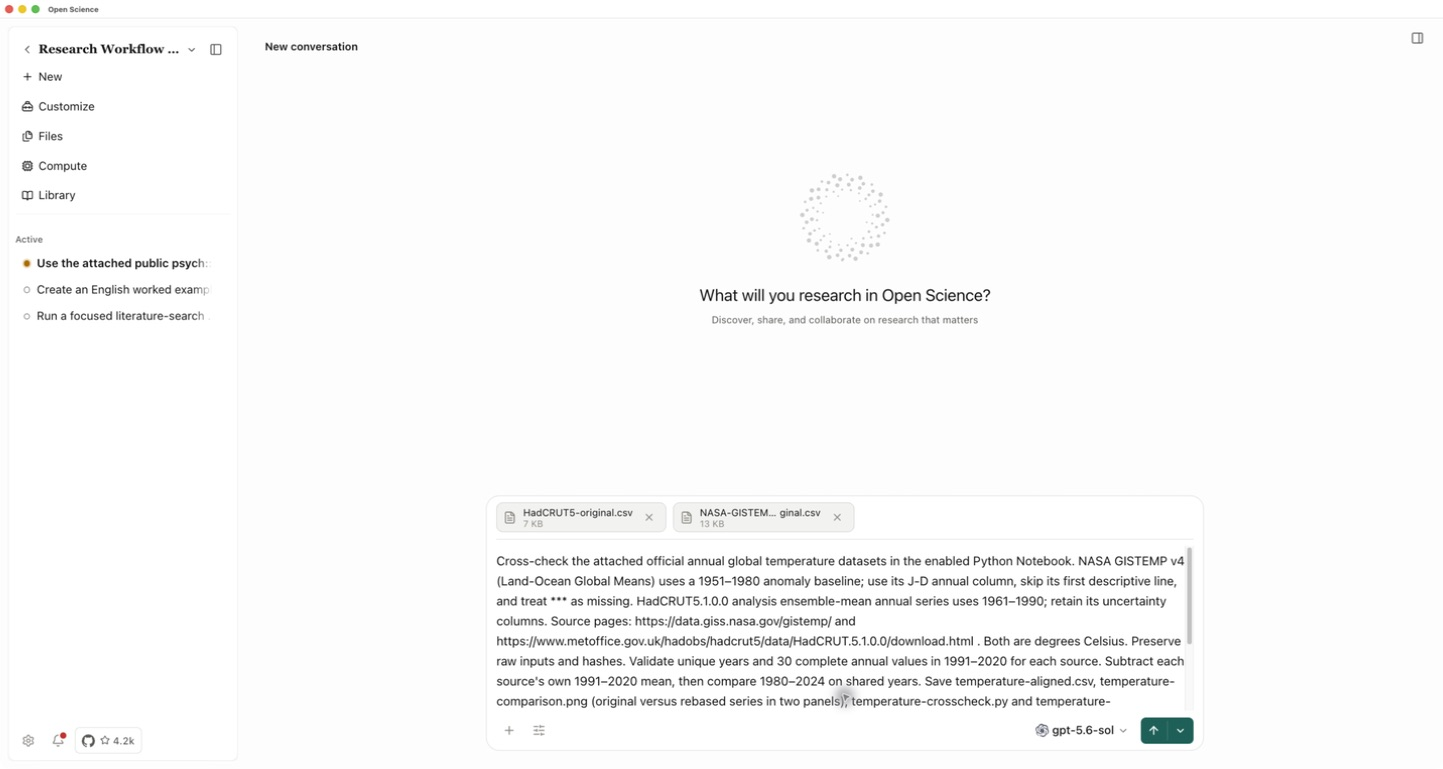
2. Ask for alignment before interpretation
Read the two attached official annual global temperature CSVs.
Use NASA's J-D annual column and the HadCRUT5 ensemble mean, in Celsius.
Check unique years, missing values, source definitions and original
anomaly baselines. Preserve the HadCRUT confidence-limit columns.
Rebase each source by subtracting its own complete 1991–2020 mean,
then align shared years 1980–2024. Report NASA minus HadCRUT:
mean difference, RMSE, maximum absolute difference and its year.
Save temperature-aligned.csv, temperature-comparison.png,
temperature-crosscheck.py and temperature-crosscheck.md.
Plot original and common-baseline series in separate labelled panels.
The script must accept --nasa, --hadcrut and --outdir arguments.
Execute using a noninteractive plotting backend, reopen the saved files,
and record input hashes and versions. Do not install packages or
claim the sources are independent or either is ground truth. Use English.
Inspect the proposed file reads and Python code before approving. Open Notebook to check that the calculation completed. If there is an error, resolve it and rerun before interpreting a report or figure.
3. Check the aligned table
Open temperature-aligned.csv. The recorded comparison contains 45 shared years. Each source has all 30 annual point estimates required for its 1991–2020 reference mean; no missing annual value was filled with zero.
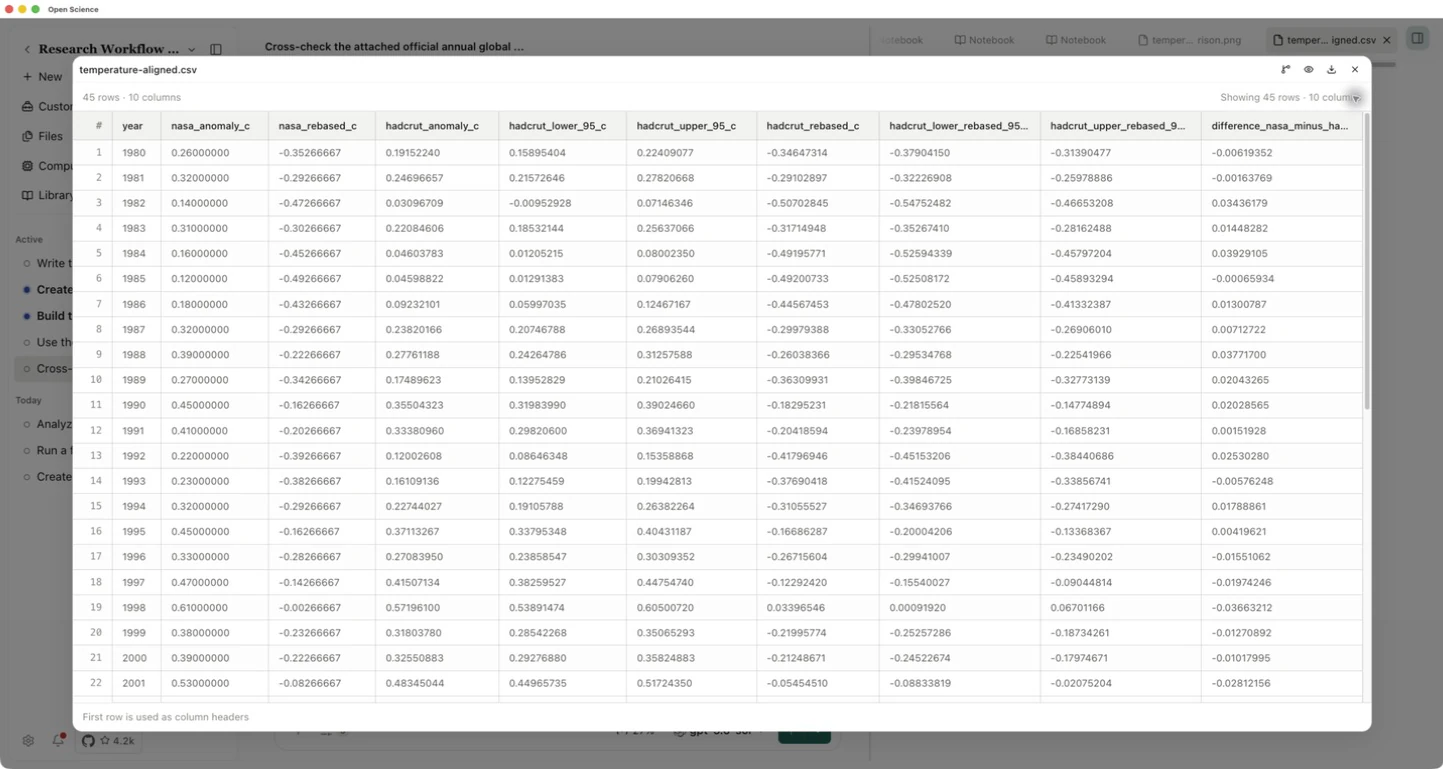
The subtracted means are 0.61266667 °C for NASA and 0.53799554 °C for HadCRUT. Subtract each dataset's own mean, not a single offset from both. Check the unit, year and subtraction direction before comparing numerical differences.
4. Read the figure and numerical comparison
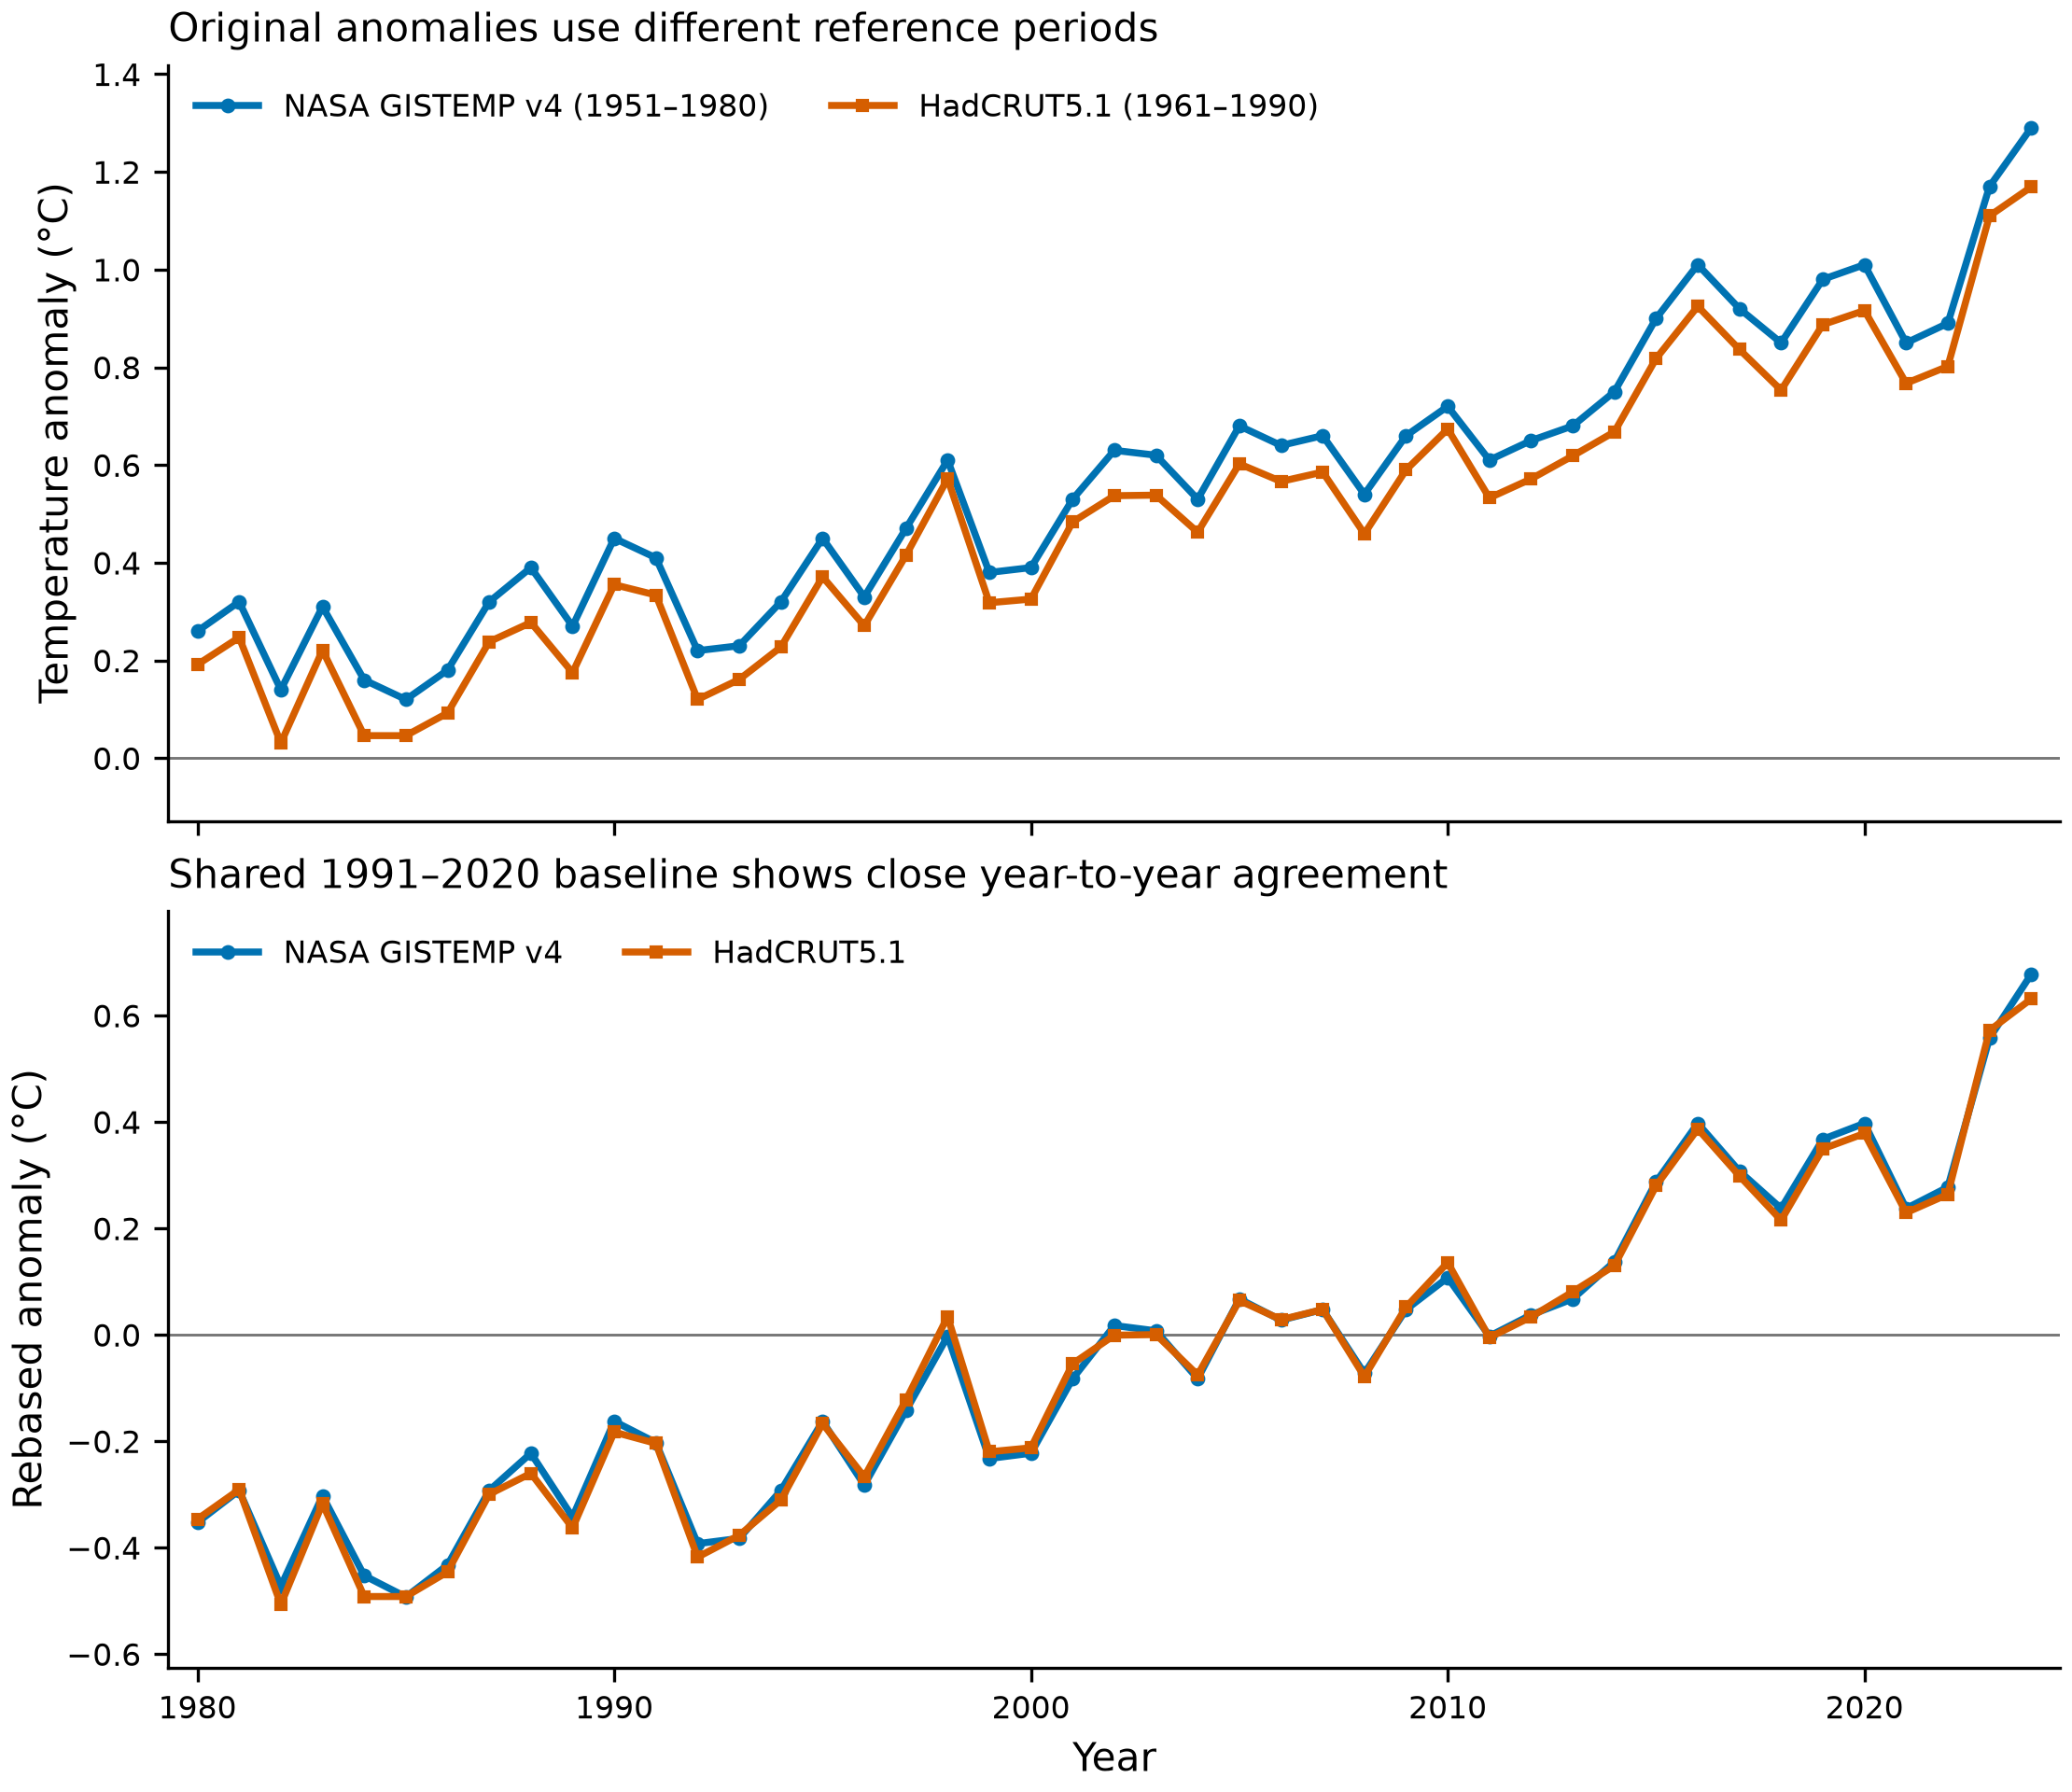
Open temperature-comparison.png. The first panel retains the different original baselines; the second compares the two series after common-period rebasing.
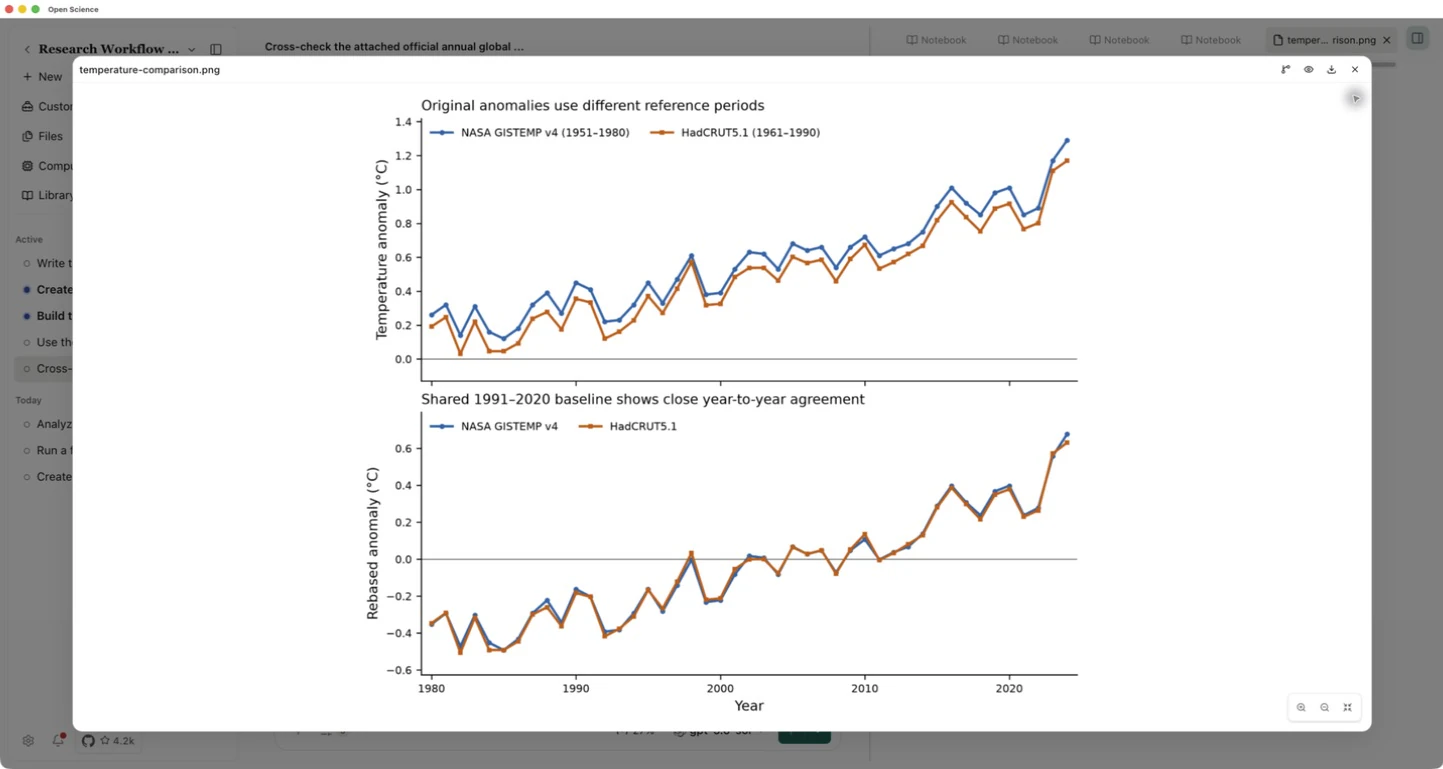
| Recorded result, NASA minus HadCRUT | Value |
|---|---|
| Mean difference | 0.00514589 °C |
| RMSE | 0.01829900 °C |
| Maximum absolute difference | 0.04632368 °C, in 2024 |
The figures are results for these downloaded snapshots. Remaining differences can reflect coverage, infilling, source observations and processing choices. The datasets share observations and are not statistically independent measurements. Neither is designated ground truth.
5. Save the method and rerun it
Open temperature-crosscheck.md and compare its source definitions and metrics with the CSV and code. The table retains the original HadCRUT confidence limits and their mechanically shifted values, but the comparison does not propagate uncertainty in the estimated baseline or between-source dependence.
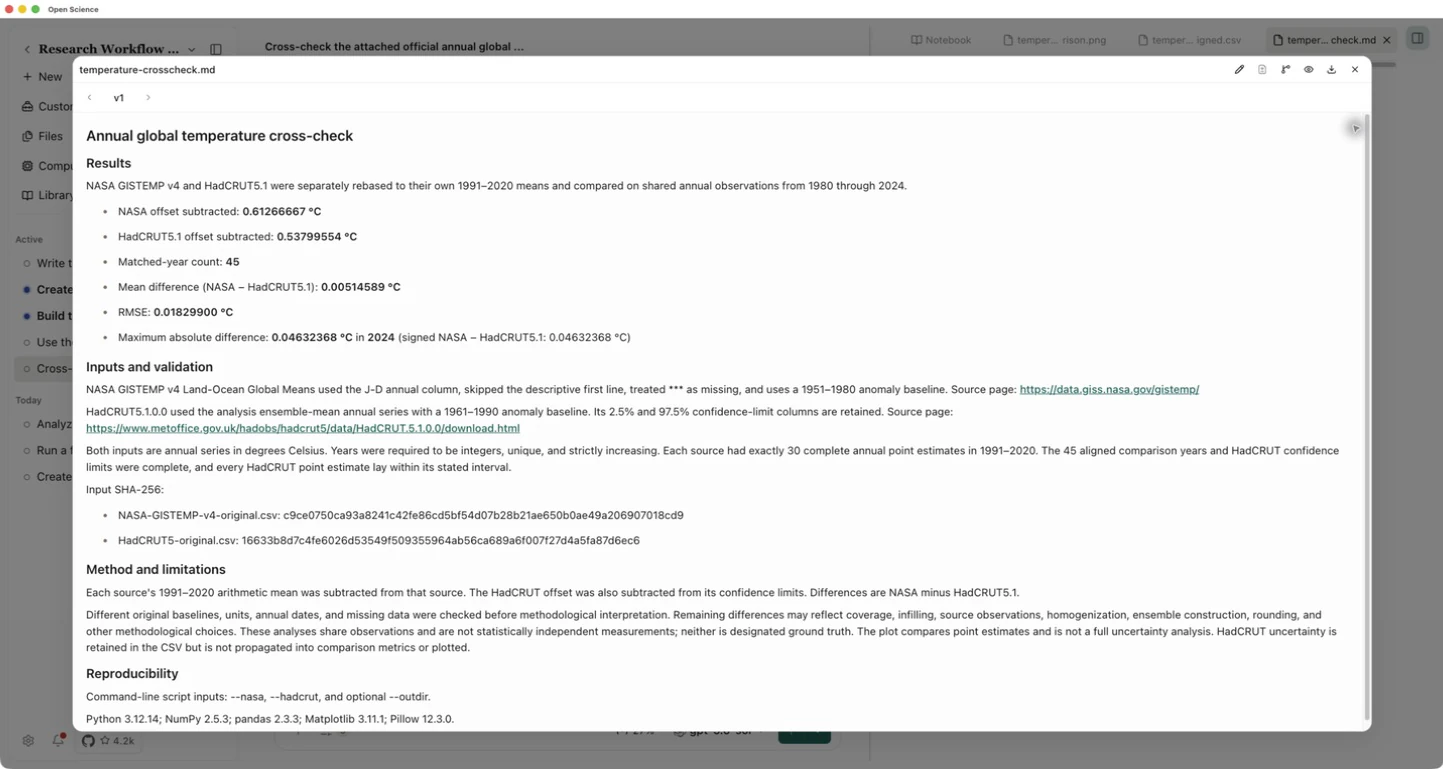
Download the aligned CSV, figure, Python script and report. With the two input files available, rerun in a Python environment containing the listed libraries:
python temperature-crosscheck.py --nasa NASA-GISTEMP-v4-original.csv --hadcrut HadCRUT5-original.csv --outdir comparison-rerun
The recorded script was also run in a separate local Python process; its aligned CSV matched the app's saved CSV exactly. An agreement check assesses this computation, not every methodological choice in either climate product.