Rerun an analysis with updated data
Worked example Add a second week of Beijing air-quality observations
When new observations arrive, preserve the baseline and rerun the same method before comparing results. This example uses actual Aotizhongxin hourly PM2.5 data: January 1–7, 2016 first, then January 8–14. The staged arrival is a historical teaching replay, not live monitoring.
1. Attach the first week and define the calculation
The inputs are chronological subsets of the UCI Beijing Multi-Site Air Quality dataset, distributed under CC BY 4.0. Download week 1 and week 2; source credit and file identities are in the source notes.
Open a project conversation and attach air-week1.csv only through + → Attach files. Select an available model and confirm Python is Ready and enabled in Settings → Runtimes. Send:
Analyze the attached first week of Aotizhongxin hourly PM2.5 data.
Validate station, dates, numeric PM2.5, duplicate and missing timestamps.
Preserve missing observations; never replace them with zero.
Calculate daily means in micrograms per cubic metre and valid-hour
counts. Mark a day complete when at least 18 PM2.5 hours are valid;
this is our teaching convention, not an official air-quality standard.
Save air-analysis.py, air-daily-v1.csv, air-daily-v1.png and
air-report-v1.md. The script must accept one or more CSV paths plus
--output-prefix and --report. Execute it, reopen the files and record
input/script hashes. Stop after this baseline. Use English.
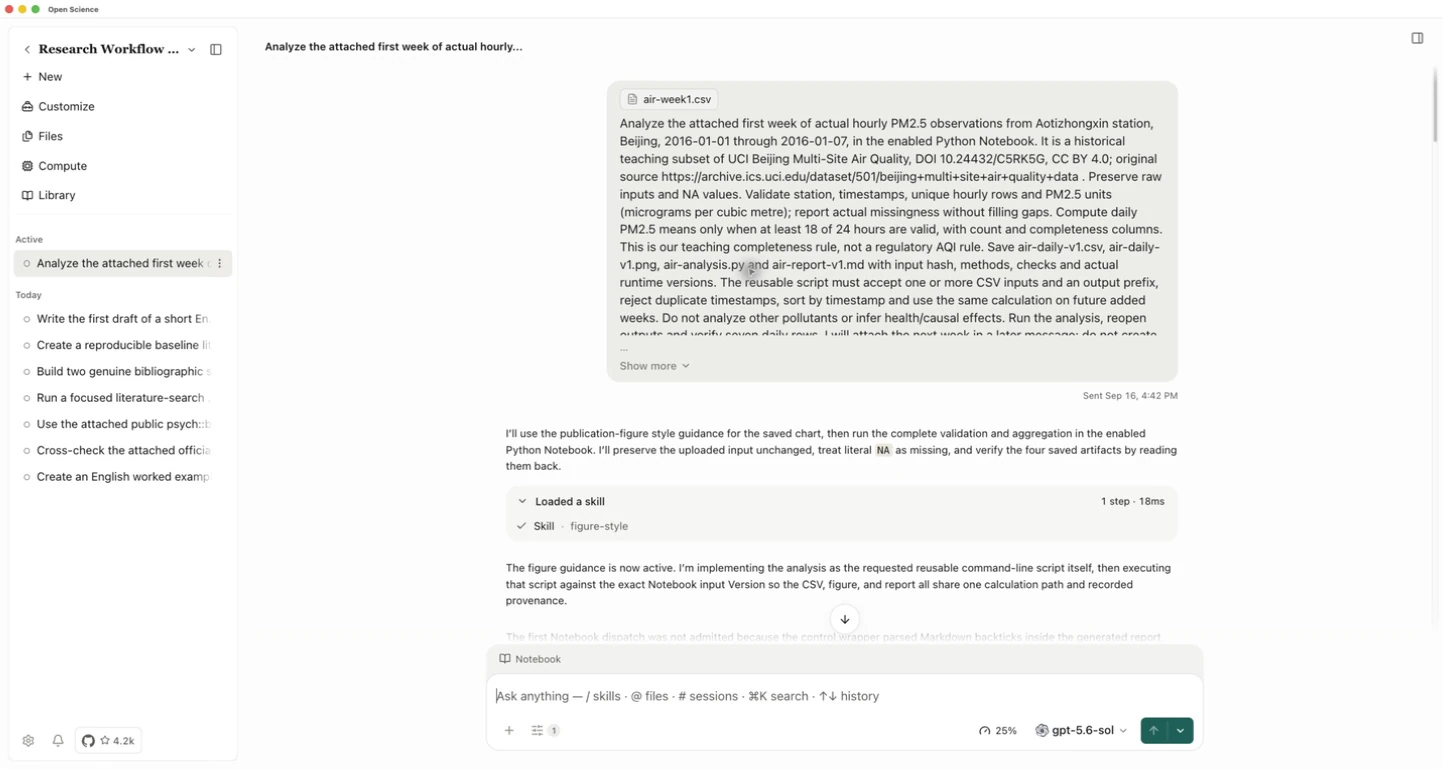
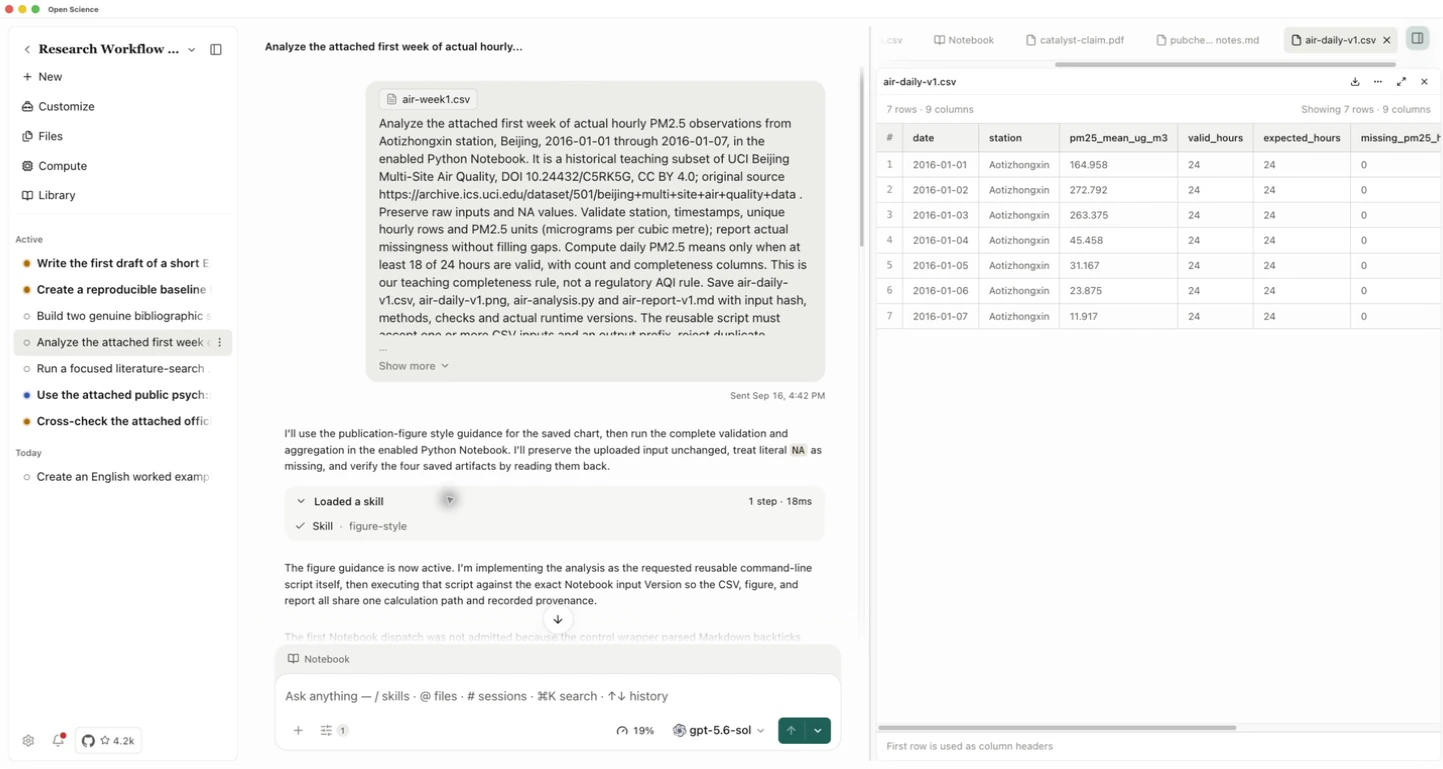
Review the file reads and computation before approving. In Notebook, check that execution finishes, then open air-daily-v1.csv. The baseline contains 168 hourly rows and 7 daily rows, with no missing PM2.5 values.
2. Add new observations without changing the method
Keep the same conversation. Attach air-week2.csv, leave the first attachment available, and request:
Read the newly attached air-week2.csv together with the original week 1.
Run the saved air-analysis.py unchanged using a new output prefix v2.
Do not overwrite the v1 files or regenerate a different analysis method.
Save air-daily-v2.csv, air-daily-v2.png and air-report-v2.md.
Compare every shared date and output field against air-daily-v1.csv.
Save air-update-check.csv and air-update-notes.md with new dates,
changed original rows, missing values and script/input hashes.
Reopen the saved results. This is a historical replay, not live data.
Use English and do not make health or causal claims.
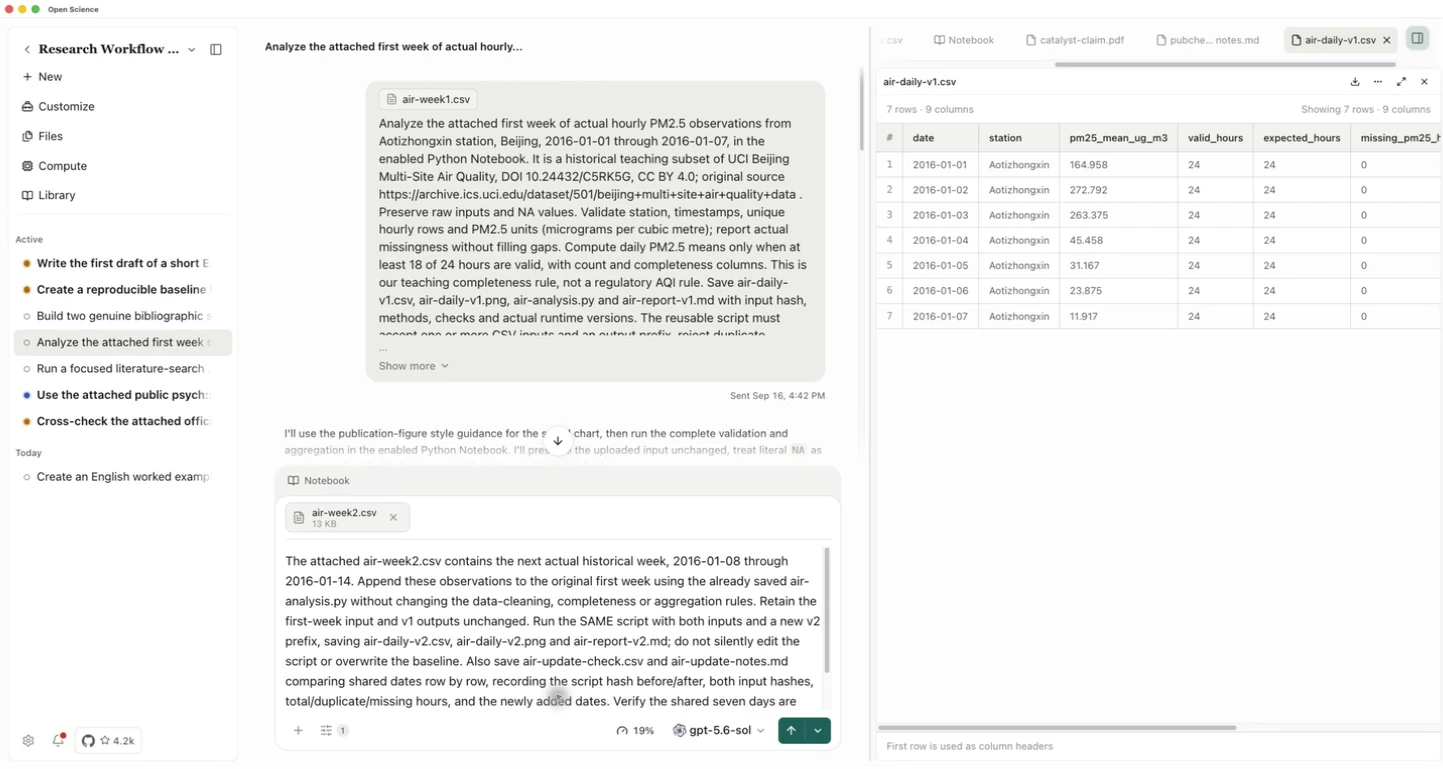
Verify that the Agent runs the existing script and keeps the same missing-value and completeness rules. Changing both data and method would make it harder to explain why the result changed.
3. Inspect the expanded results
Open air-daily-v2.png and air-daily-v2.csv. The combined input contains 336 hourly rows, with no duplicate or missing timestamps. There is one missing PM2.5 observation, on January 11. The table has 14 days, all meeting the example's 18-valid-hour rule.
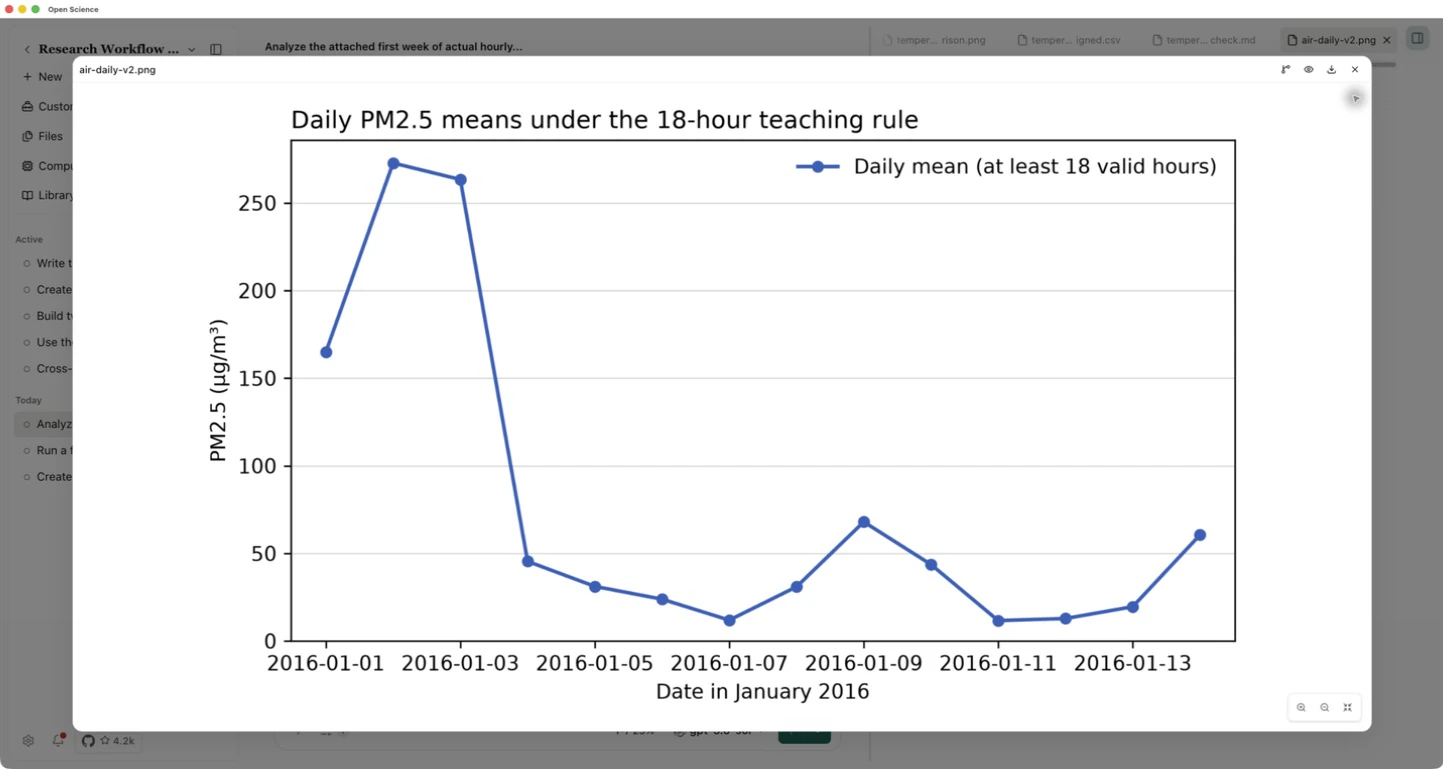
The January 11 mean is 11.652 µg/m³, calculated from 23 valid hours. Do not divide a missing observation in as if it were zero. A complete timestamp sequence does not guarantee that all measurement values are present.
4. Compare against the baseline
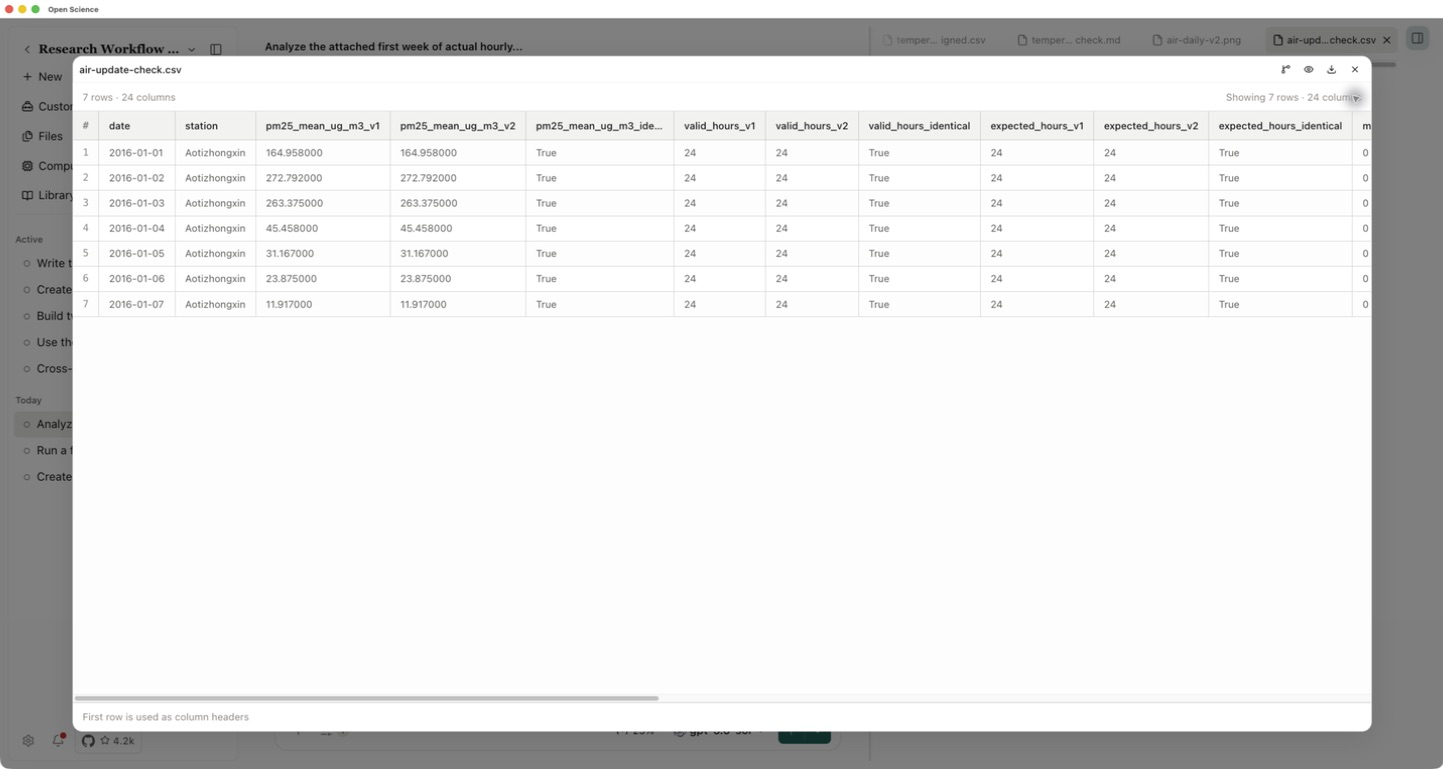
Open air-update-check.csv. All seven shared daily rows are identical across every output field; the only new dates are January 8–14. The original script's SHA-256 is unchanged before and after the update.
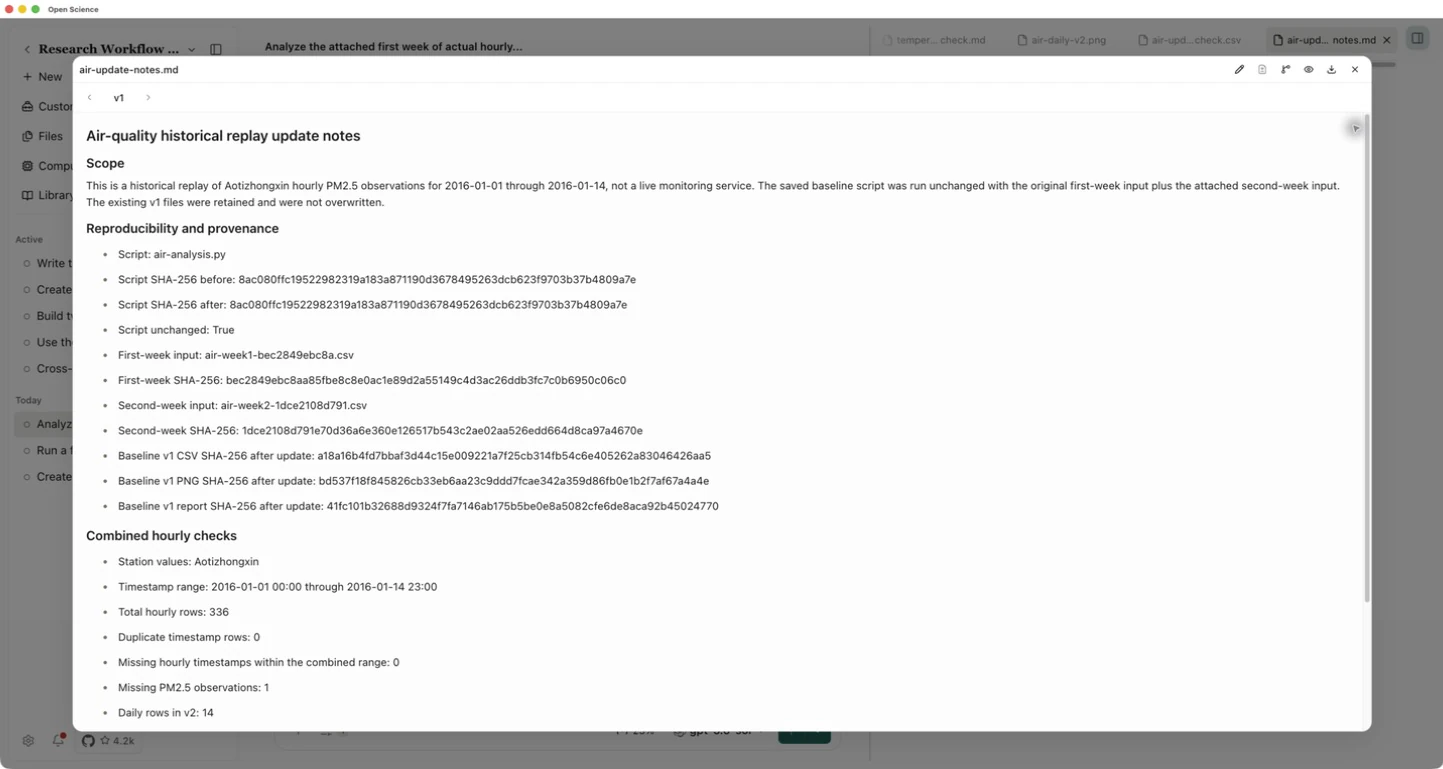
Open air-update-notes.md to check input identities, missing observations and the retained v1 files. An independent calculation of all 14 daily means and valid-hour counts matched the saved output to its displayed precision.
5. Check the report dates before handing it off
Check that the report heading follows the actual input interval. The initial script retained a first-week title in its two-week report; that presentation error was corrected in air-analysis-reviewed.py. Only the heading template changed. The reviewed script was then run unchanged on week 1 and on both weeks, preserving all previous files.
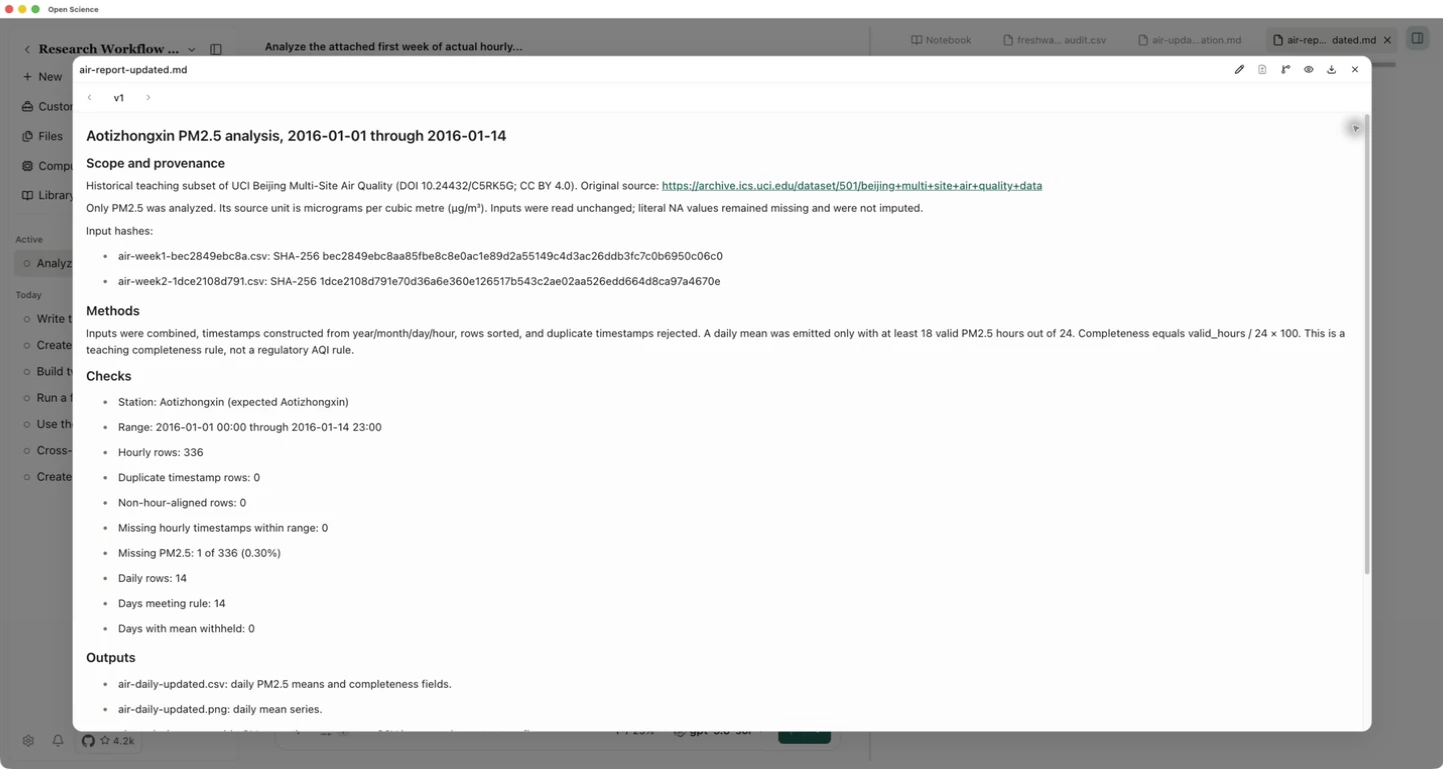
The saved air-daily-baseline.csv and air-daily-updated.csv match the original v1/v2 CSVs in every field. air-update-verification.md records the same reviewed script hash before and after both runs, and checks the two report headings. This separates a corrected label from a change in the numerical method.
Download the reviewed Python script, baseline CSV, updated CSV, row comparison, updated report and verification note. Use Python with pandas, NumPy and Matplotlib, retain both inputs, and write to a fresh prefix:
python air-analysis-reviewed.py air-week1.csv air-week2.csv --output-prefix air-daily-rerun --report air-report-rerun.md
The comparison describes one station and two historical weeks. It is not an AQI classification, an exposure assessment or evidence of a causal intervention. For a change in analysis method while retaining the same data, see compare methods.