Compare two analysis methods on the same data
Worked example PCA and exploratory factor analysis of the psych::bfi items
Changing methods is informative only when the inputs and preprocessing are comparable. This example applies standardized principal component analysis (PCA) and five-factor maximum-likelihood factor analysis (FA) to the same 2,436 complete responses. It compares what the methods estimate, rather than treating the largest number as the winning method.
1. Prepare the public input and R runtime
Download the public psych::bfi CSV, save it as bfi-original.csv, and read the dataset documentation. It contains 2,800 respondents, 25 personality items and demographic columns. The analysis uses only A1–A5, C1–C5, E1–E5, N1–N5 and O1–O5; it is not an individual psychological assessment.
In Settings → Runtimes, confirm R is Ready and enabled. The recorded run used R 4.4.3, with base/recommended R functions and no extra package installation. Attach the CSV to a project conversation through + → Attach files.

2. Fix the preprocessing before fitting either method
Use the attached psych::bfi CSV in the enabled R Notebook.
Analyze only its 25 A/C/E/N/O items, scored 1–6. Validate the range.
Reverse A1, C4, C5, E1, E2, O2 and O5 as 7-x. Use the same complete
cases across all 25 items for both methods; report exclusions.
Run prcomp with centering/scaling and retain five components.
Varimax-rotate eigenvector times sqrt(eigenvalue) loading columns;
label them RotPC1–RotPC5. Report variance from unrotated PC1–PC5.
Run factanal with five factors, varimax and nstart=10; set seed 20260916.
Save bfi-method-comparison.R, bfi-preprocessing.csv, bfi-loadings.csv,
bfi-method-metrics.csv, bfi-method-comparison.png and bfi-method-report.md.
Make the script accept the input CSV as its first argument, record
runtime input identity and R version, execute it and reopen all outputs.
Explain fit, convergence, arbitrary signs/order, ordinal responses
and complete-case limitations. Do not claim that convergence is good fit.
Use English and do not install packages or delegate.
Review the R calculation before approving it. Open Notebook and confirm execution completed. The saved preprocessing matrix has 2,436 rows × 25 items, excluding 364 incomplete respondents. This same matrix feeds both methods; demographics and row identifiers are excluded.
If one method silently uses a different set of respondents, stop and reconcile the inputs before comparing its result.
3. Inspect the numerical results
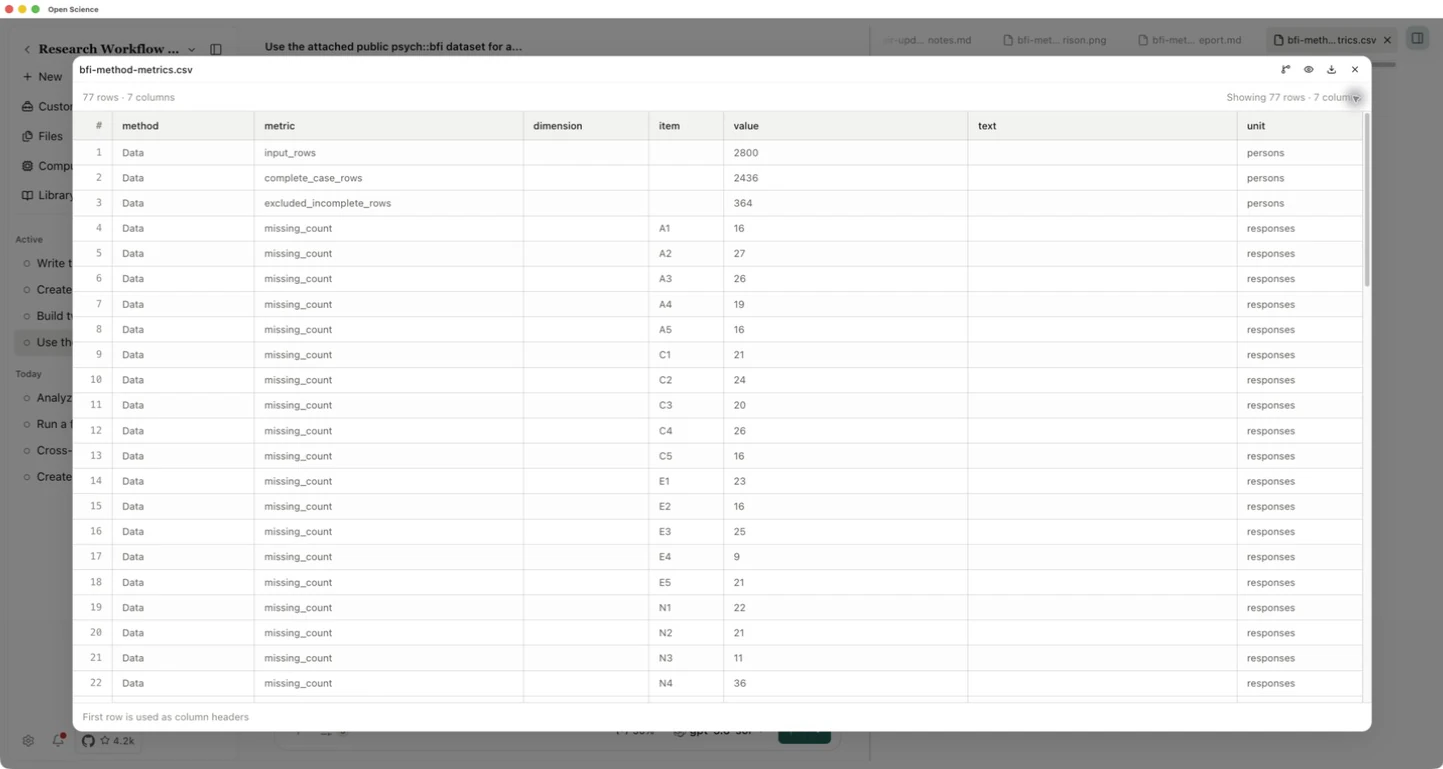
Open bfi-method-metrics.csv from Generated or Files. The recorded file contains 77 metric rows, including sample counts, missingness, PCA variance, FA uniquenesses, fit, convergence, seed and input identity.
| Unrotated PCA component | Total standardized variance explained |
|---|---|
| PC1 | 20.54% |
| PC2 | 11.01% |
| PC3 | 8.57% |
| PC4 | 7.41% |
| PC5 | 6.19% |
| First five combined | 53.72% |
The FA optimizer converged, but the likelihood-ratio statistic was 1490.587 on 185 degrees of freedom, with p ≈ 1.218 × 10⁻²⁰². Under the model assumptions, this rejects exact five-factor fit. Successful numerical execution does not establish adequate fit.
4. Compare the loading patterns in the figure
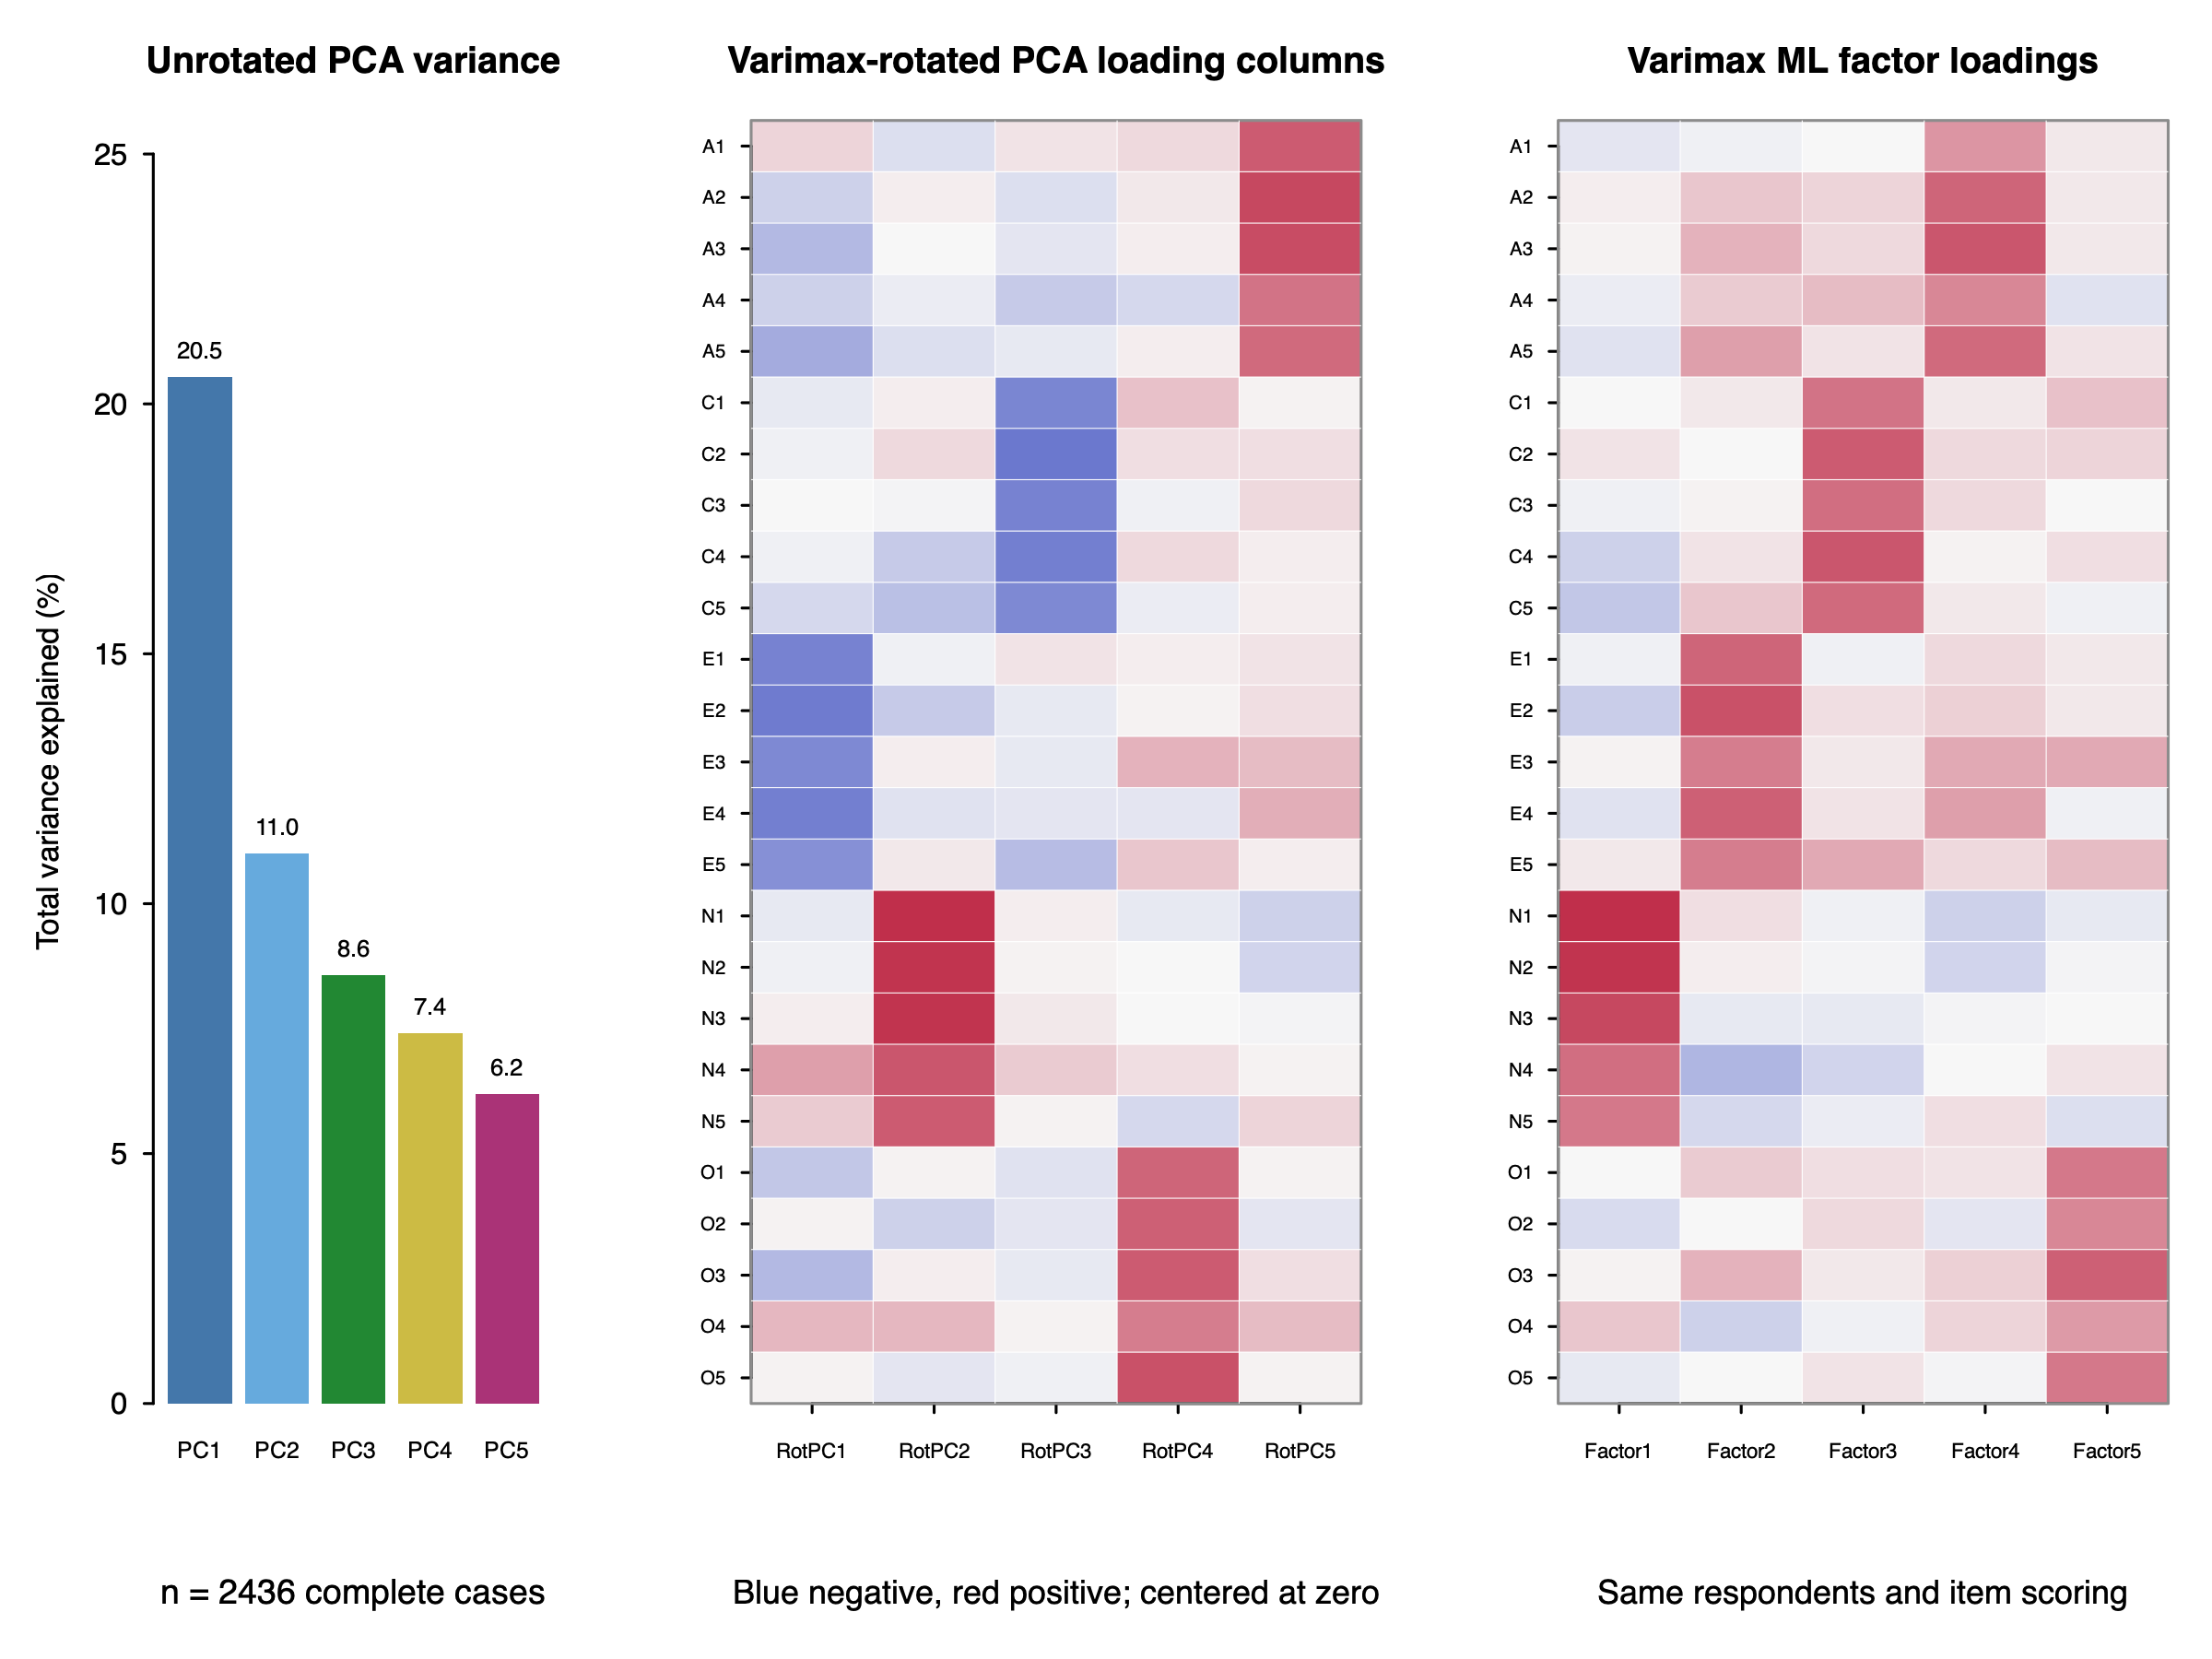
Open bfi-method-comparison.png. Its three panels show unrotated PCA variance, varimax-rotated PCA loadings and varimax FA loadings. The exact loading values are in bfi-loadings.csv, with 250 rows: 25 items × 5 dimensions × 2 methods.
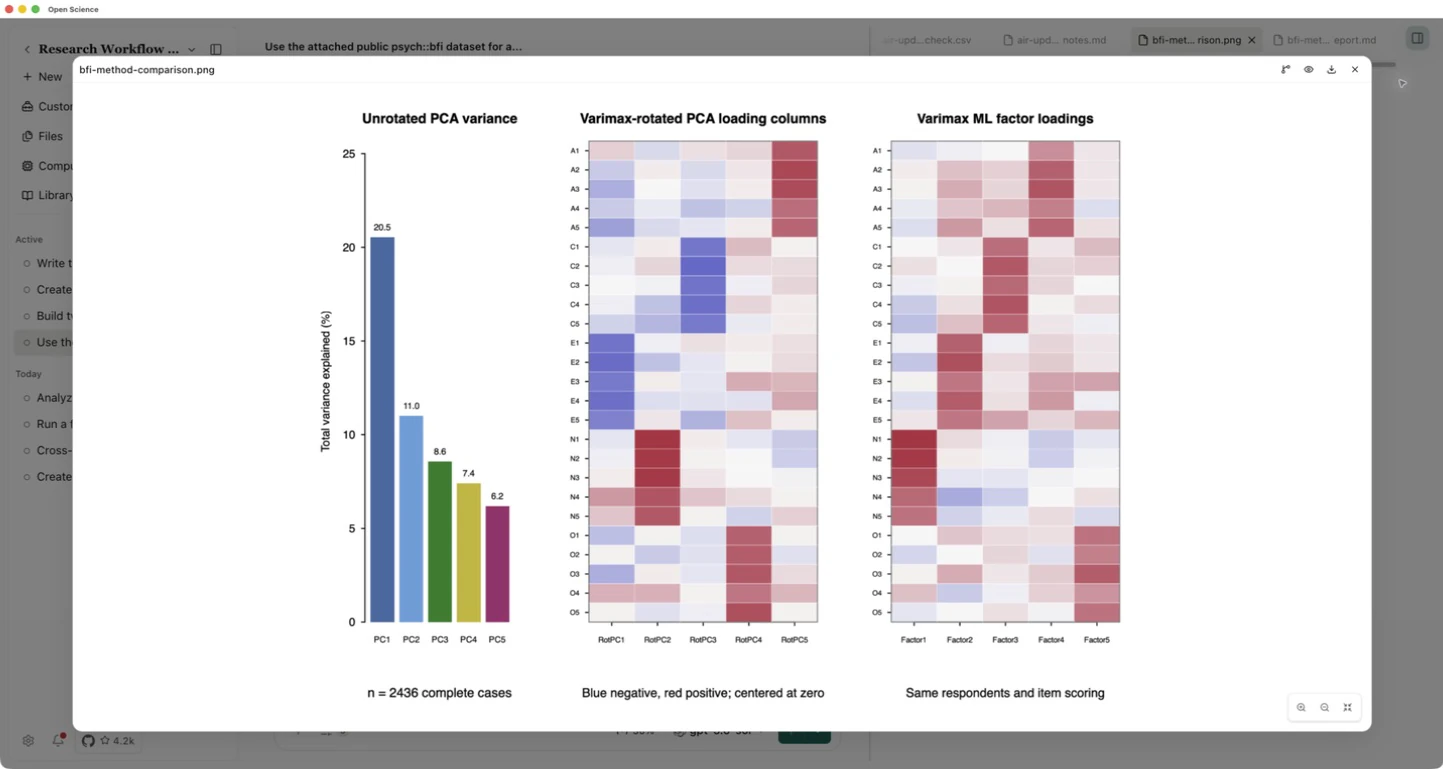
Do not match “column 1” mechanically across the methods. Factor/component order and signs can change without changing the solution. The heatmaps use blue for negative and red for positive loadings; compare item patterns and numerical values.
PCA partitions total observed variance; FA models shared covariance with separate uniquenesses. FA sums of squared loadings are not interchangeable with PCA variance explained. The rotated labels RotPC1–RotPC5 are intentionally distinguished from the unrotated PC1–PC5 variance percentages.
5. Read the limitations and rerun the saved script
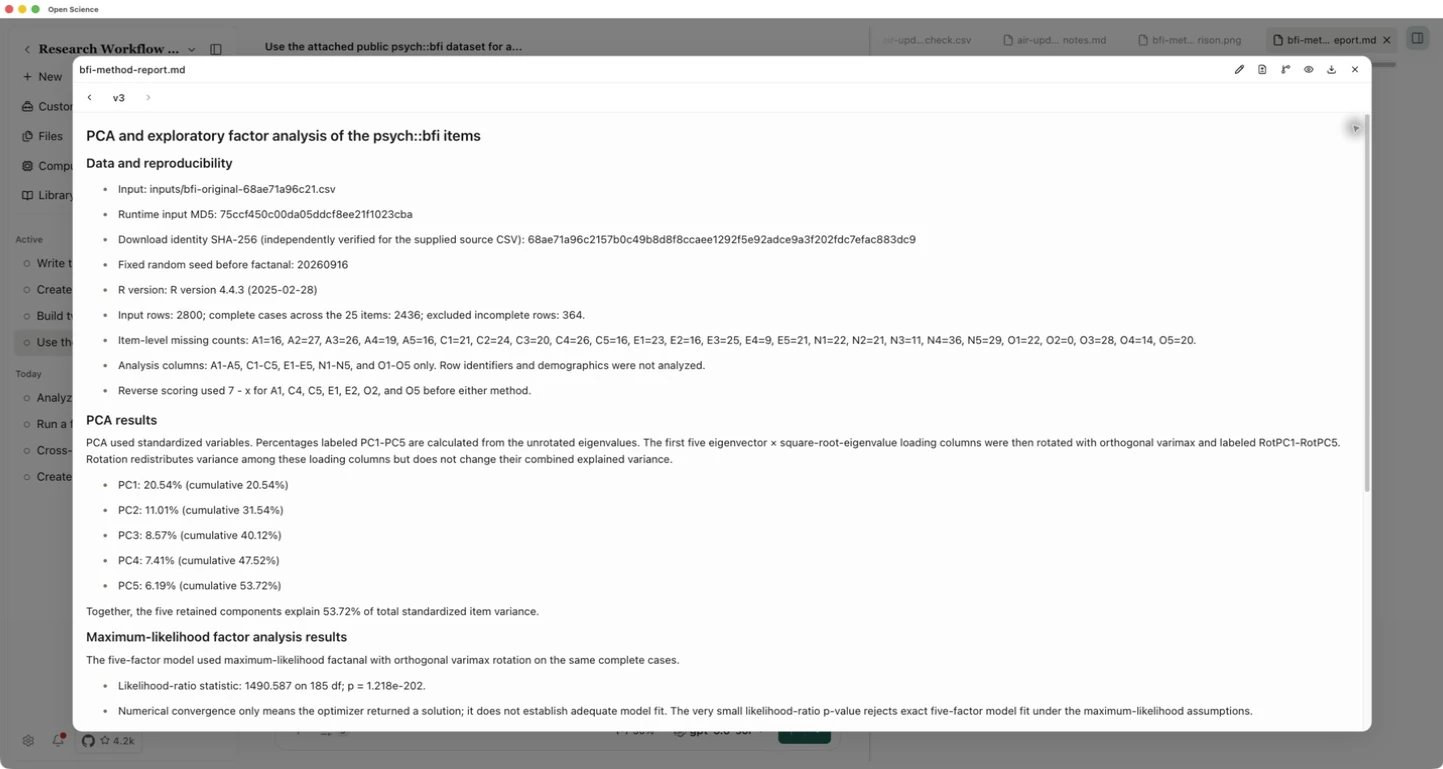
Open bfi-method-report.md. Check that it reports the same sample and preprocessing, the fixed seed and the difference between convergence and fit. These 1–6 ordinal responses are treated as approximately continuous; complete-case deletion can bias results when missingness relates to responses or participant characteristics.
Download the R script, loadings, metrics, figure and report. Put the script and downloaded input in a fresh folder, open a terminal there and run:
Rscript bfi-method-comparison.R bfi-original.csv
The script writes its outputs in the current folder. The recorded script was independently rerun with R 4.4.3: preprocessing, loadings and metric CSVs matched the app's saved files exactly. All preprocessing cells and PCA eigenvalues were also checked separately. These checks establish this calculation's reproducibility; they do not choose a universally superior method or validate a diagnostic test.