Tables and datasets
Use the preview to understand a table's structure, then use Python or R to validate and transform the complete file. Common viewing and download controls belong to Opening and previewing files; renderer bounds and extensions are listed in File formats.
For a table embedded in a literature PDF, use PDF extraction, then reopen the exported table and check its headers, values and notes against the source.
Identify what one row represents
Worked example Read sample identifiers and metrics in a QC table
- Open the example QC table from a saved result, Files or an attachment.
- Read the column names and decide whether rows represent samples, genes or another unit. In this output, each row is a sample; in its source matrix, each row is a gene.
- Locate the full identifier column. Keep short plotting labels mapped to those identifiers.
- Read the displayed range before estimating dataset size. Use a full-file calculation when the preview is bounded.
- Compare sample values with the shared QC baseline.
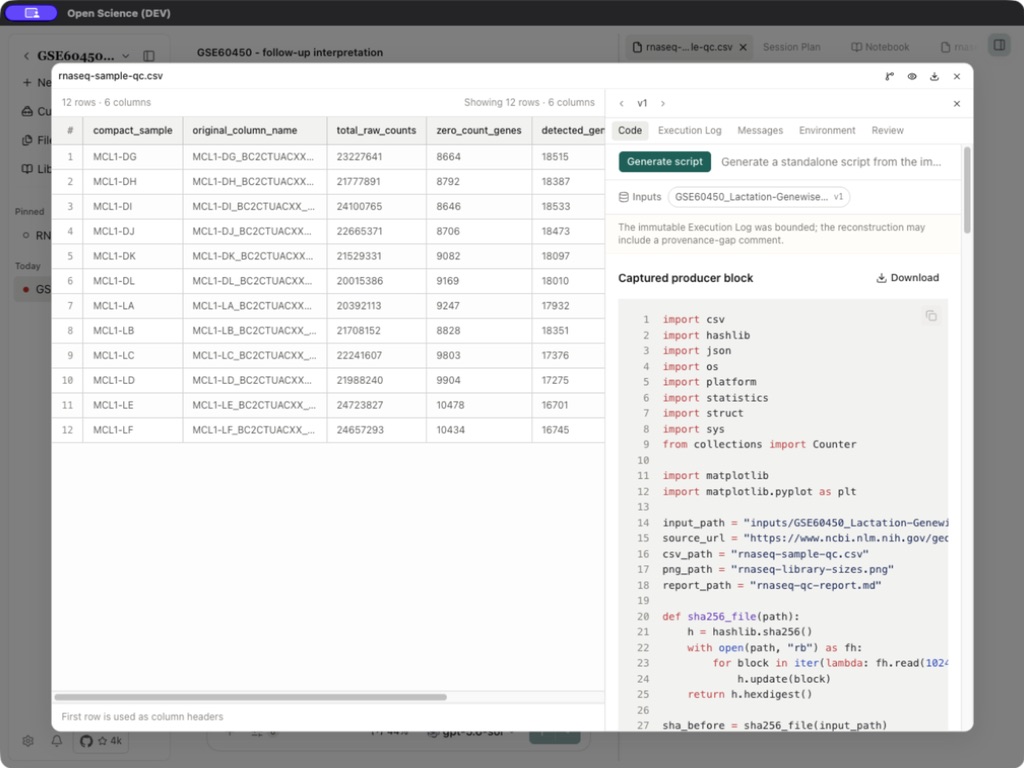
QC table: column meanings
| Column | Interpretation | Check before using it |
|---|---|---|
| compact_sample | Short figure label | Retain its mapping to the original identifier |
| original_column_name | Original sample identifier | Check missing and duplicate names |
| total_raw_counts | Sum of sample counts | Preserve raw-count units; do not call this normalized expression |
| zero_count_genes | Number of genes with zero counts | Together with detected genes, must cover all input gene rows |
| detected_genes_count_gt_0 | Number of genes with positive counts | This is a count of genes, not expression magnitude |
| median_count_among_detected_genes | Median over positive counts | State that zero-count genes are excluded |
Check the complete dataset
Separate identifiers and metadata from measurement columns before selecting numerical operations. Preserve gene IDs as identifiers and keep gene length out of sample-count calculations. Check missing values, duplicate identifiers and allowed value ranges in the complete input.
A visible row count can describe only the preview. Read the complete file in Notebook to establish dimensions. The CSV renderer is read-only; header clicks are not a substitute for a sorting or filtering operation.
Save transformations as new results
State the join key, filter rule, missing-value policy and expected output columns in your request. Ask for a separate derived file so that the original input remains available. Reopen the output, compare its row count and identifiers with the input, and inspect the executed code before interpreting changes.
Notebook variables are temporary kernel state until saved. A visible variable and a managed file version have different lifecycles; use Files and versions to retain and compare saved results.
Choose a reader for other formats
For .xls/.xlsx, use the Office preview and worksheet controls described in Previews. Binary containers such as .h5ad or .h5 require a compatible analysis library. A tab-separated .txt matrix may open as text. Renaming an extension does not convert data or make an unsupported format readable.