Token usage and activity
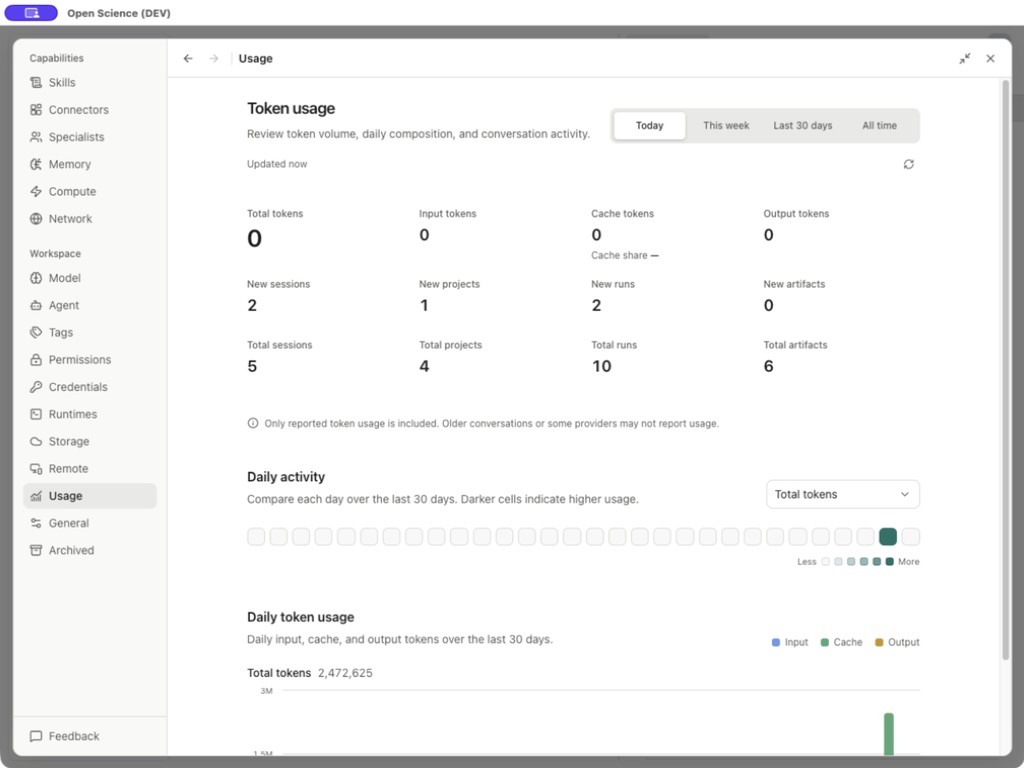
Use Settings → Usage to inspect reported token volume and local activity. Use a response's Token usage menu or the session Context window for a narrower view. These answer different questions: total calls can consume many tokens while the current context occupies a much smaller window.
Use the displayed period and metric to interpret each chart. Reported token counts describe activity; check subscription limits or billing with the provider.
Filter the summary
- Open Usage and choose Today, This week, Last 30 days or All time.
- Read the freshness label. Use Refresh after a completed run if the page is stale.
- Compare the four token fields and the New/Total activity counters.
- Check the chart's own period label before comparing it with the summary.
| Field | Interpretation |
|---|---|
| Total tokens | Reported aggregate for the selected period. |
| Input tokens | Reported input component; do not substitute a local text-length estimate. |
| Cache tokens | Usage attributed to cache by the reporting backend. |
| Cache share | A proportion of relevant input/cache volume; a dash means unavailable, not a zero-priced run. |
| Output tokens | Reported generated output component. |
| New sessions/projects/runs/artifacts | Items created in the selected period. |
| Total sessions/projects/runs/artifacts | Overall counts; they need not equal the period's New counts. |
In the operated Today view, token totals were zero before the current run had recorded its usage, while the fixed 30-day chart still contained yesterday's activity. That is expected period behavior, not inconsistent counting. Uploads and generated artifacts are different resources; uploading a source file does not by itself create a generated artifact.
Read daily activity and composition
Daily activity metric offers Total tokens, Input tokens, Output tokens, Cache tokens, New sessions, New projects, New artifacts and Runs. Select a metric, then inspect a date cell. Darker cells represent larger values within the displayed scale.
Daily token usage shows stacked input, cache and output components. Both charts are labeled last 30 days; changing the top summary period does not change that fixed range. Compare like periods before drawing conclusions about increases.
Explain missing or unexpected values
| Symptom | Check |
|---|---|
| A completed conversation has no usage | Some providers and older records omit telemetry. Refresh once, then inspect the response's own usage. |
| High total but a small Context used percentage | Total usage accumulates calls; context measures occupancy at a point in time. |
| New counters change without token use | Project creation and session management can occur without a model request. |
| Totals do not resemble an invoice | This page is not the provider's billing ledger or subscription-limit dashboard. |
| A large cache component | Read the reported breakdown; do not infer cash savings without the provider's actual billing rules. |
The page includes only reported usage. It does not reconstruct missing history. For context composition and compaction, see Memory and conversation context.
Source: Usage panel and chart controls.