Your first project and result
Worked example Read a sample-QC table and save a summary
Start by opening a small table and saving a summary. This route uses the twelve-row sample-QC table calculated from a real public gene-expression dataset. You do not need to rerun the full matrix analysis or install plotting packages.
Prepare a model and the example file
- Complete first-time setup and confirm your model connection.
- Download the sample QC CSV from Example data.
- Keep the downloaded file unchanged. This is a derived summary table; the source matrix and calculation method are documented on the same example page.
Opening and summarizing this table requires an active agent and model. Python or R is needed only if you ask to recalculate metrics. The full data-quality workflow covers that route.
Create a project
From Home, choose New project. Enter Gene-count QC review as Name and Review the public sample-QC table and record its interpretation. as Description. In Agent Context, enter Preserve the source file. Explain descriptive counts without inferring differential expression. Then select Create project.
Confirm the project name above the session list. These are example names: use a name that helps you find your own investigation later. See Projects to edit the fields or configure a source folder.
Attach and inspect the table
- Start a new conversation, choose + → Attach files, and select the downloaded CSV.
- Wait for the attachment chip, then open its preview.
- Confirm twelve sample rows. Inspect the full sample identifier and the columns for total counts, zero-count genes, detected genes and the median positive count.
- Close the preview to return to the composer. Keep the attachment in the request.
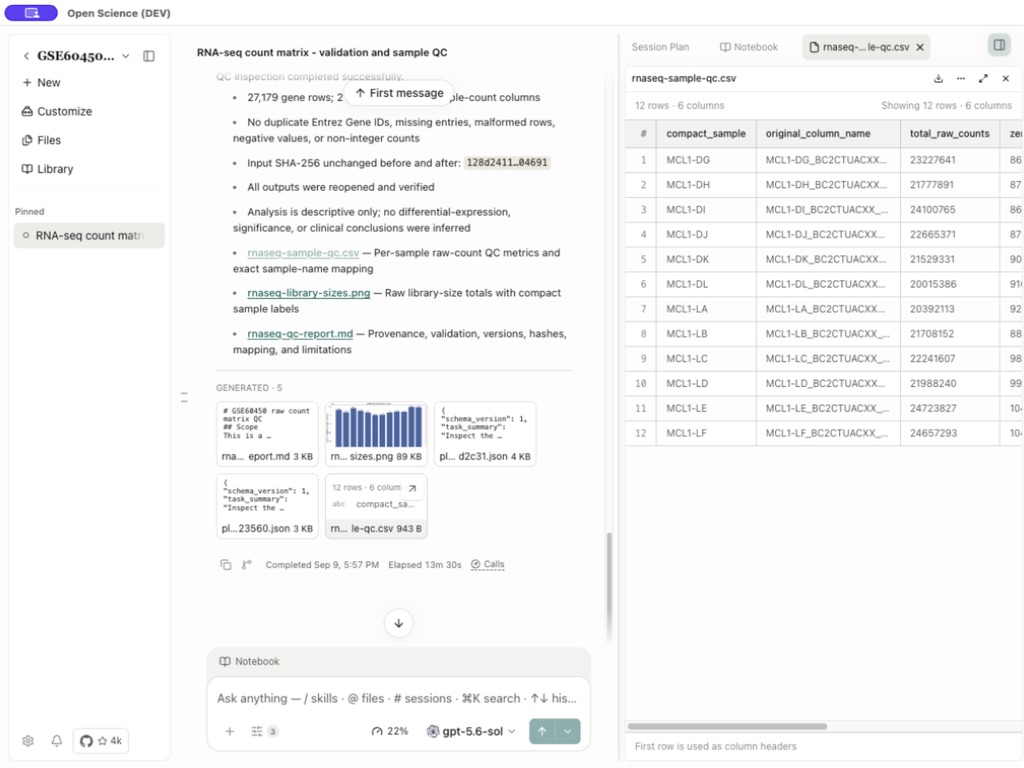
If the preview is empty or the columns are not separated, confirm you attached the CSV rather than an HTML download page. See Tables for delimiter and preview controls.
Ask for a saved summary
Check the selected model and send:
Read the attached sample-QC CSV. Save a short Markdown report named
sample-qc-overview.md with three sections: Table contents, Metric meanings,
and Next checks. Identify the sample-identifier column and explain each
QC metric using the attached values. Preserve the original file. Do not
recalculate the gene matrix, install packages, or infer differential
expression. State that this is a derived descriptive summary. If the file
cannot be read, report the error instead of guessing its contents.
After saving, provide the report link.
When permission is requested, check that it concerns the attached input and the requested output. Approve the intended operation or deny an unrelated request. A waiting permission is a pause that needs your response; a failed tool call needs error handling. Composer explains those states.
Check and keep the result
- Select sample-qc-overview.md in the answer or the project's Files panel.
- Confirm the three requested sections and that the column descriptions match the CSV. In particular, detected genes means count greater than zero; the positive-count median excludes zero counts.
- Confirm the report describes a summary table and does not claim a new biological finding.
- Download the report if you need an external copy. Rename and pin the conversation for return access.
The task is complete when the saved report opens and agrees with the attached table. If the answer contains text but no file, ask the agent to save that text as the named Markdown file, then open it. For a read or save error, retain the error message and follow Troubleshooting.
Continue with the original data
To reproduce the table and create a plot, follow Turn raw data into a reproducible analysis. That workflow adds the original matrix, Python dependencies, an exact output schema and numerical checks. Use Notebook to inspect code and file evidence.